Bitcoin (BTC/USD) Market Struggles, Pushing Northward Above $40,000
Estimated Reading Time: 3 minutes
Don’t invest unless you’re prepared to lose all the money you invest. This is a high-risk investment and you are unlikely to be protected if something goes wrong. Take 2 minutes to learn more

Free Crypto Signals Channel
Bitcoin Price Prediction – February 6
The BTC/USD market struggles, pushing northward above the $40,000 line. The crypto-economic price has been trading in the high and low zones market at $41,739 and $41,358 at a minute positive percentage rate of 0.26.
BTC/USD Market
Key Levels
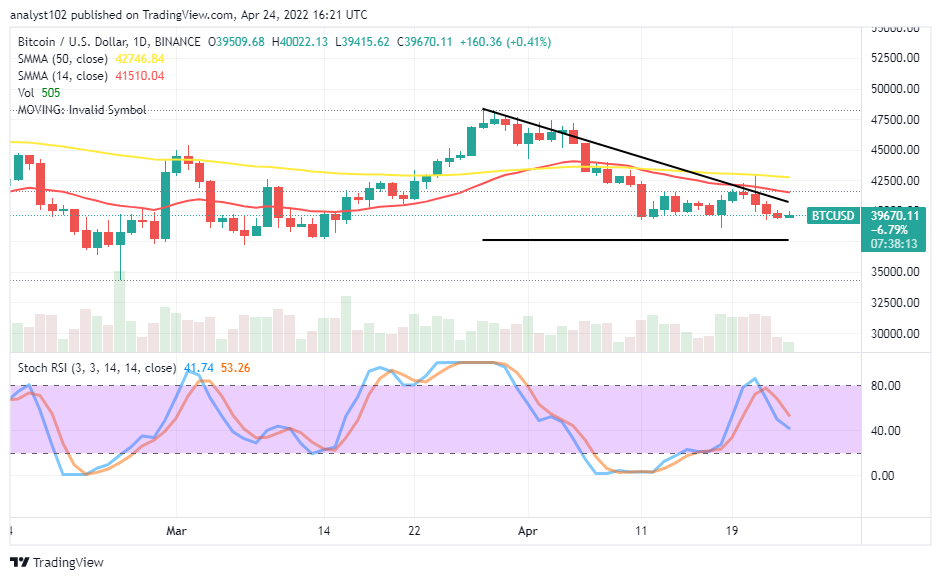
Resistance levels: $$42,500, $45,000, $47,500
Support levels: $37,500, $35,000, $32,500
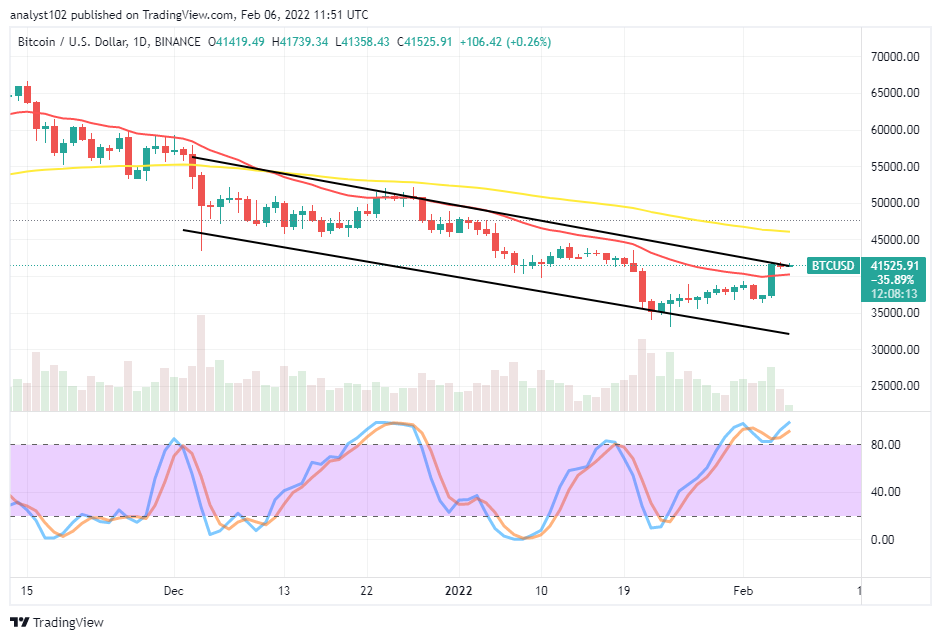
BTC/USD – Daily Chart
The BTC/USD daily chart showcases the crypto market struggles, pushing northward above the $40,000 level as it approaches the resistance level at $42,500. The 50-day SMA indicator is above the the14-day SMA indicator. The bearish channels drew southward, embodying the smaller SMA trend line. The Stochastic Oscillators are in the overbought region, moving in a consolidation manner, indicating that some upward forces are ongoing.
Will the BTC/USD trade intensify efforts to sustainably move further as the crypto market struggles, pushing northward above $40,000?
Considering the current pace that the BTC/USD trade price can move up further appears, fading out gradually as the crypto-economic market struggles, pushing northward above $40,000. A bullish candlestick that emerged on February 4 has put the price into a critical resistance trading zone; buyers may have to suspend placing more longing positions to avoid getting trapped in no time.
On the downside of the technical analysis, falling pressures are seemingly mustering toward around the $42,500 resistance. Therefore, short-position takers may have to be on the lookout to exert a sell order. The 50-day SMA trend line is positioned above the $45,000 resistance level, indicating the possible subsequent higher resistance trading spot to the value line mentioned earlier.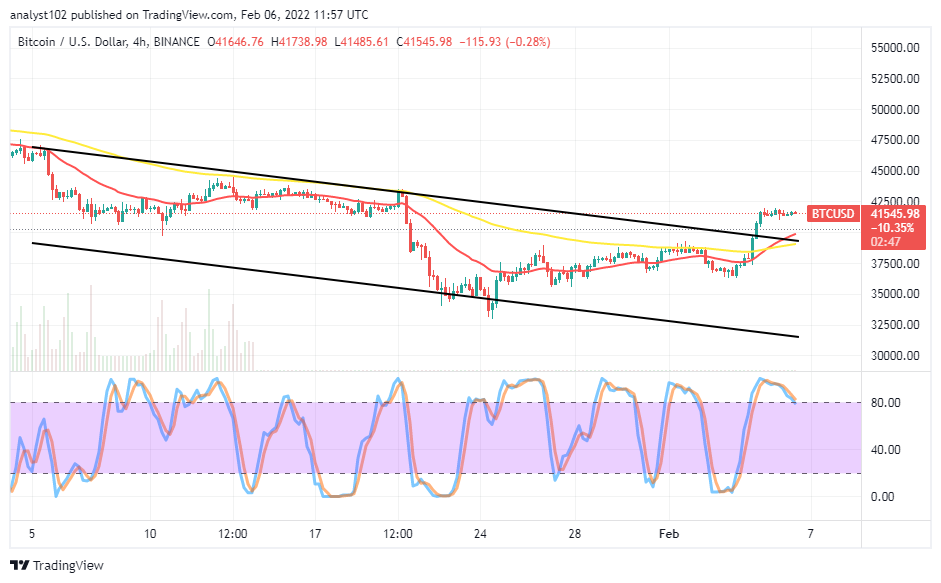
BTC/USD 4-hour Chart
The BTC/USD 4-hour chart reveals that the crypto market struggles, pushing northward above the $40,000 level as price approaches the resistance level at $42,500. The bearish channel trend lines drew southward against the area where an interception featured between the SMAs. The 50-day SMA is underneath the 14-day SMA. A line of variant candlesticks has occurred above the trend lines of the SMAs. The Stochastic Oscillators have conjoined and crossed southbound from the overbought region to touch the range of 80. That indicates the possibility of seeing a degree of downward forces in the near session.
Note: Cryptosignals.org is not a financial advisor. Do your research before investing your funds in any financial asset or presented product or event. We are not responsible for your investing results.
You can purchase crypto coins here. Buy Tokens