Bitcoin (BTC/USD) Market Swings near $35,000
Estimated Reading Time: 3 minutes
Don’t invest unless you’re prepared to lose all the money you invest. This is a high-risk investment and you are unlikely to be protected if something goes wrong. Take 2 minutes to learn more
Bitcoin Price Prediction – July 12
The BTC/USD market swings near the line of $35,000 to trade around $34,382. The current trading rate of the crypto’s price is seen at 1.15 positive percent.
BTC/USD Market
Key Levels:
Resistance levels: $37,500, $42,500, $47,500,
Support levels: $30,000, $25,000, $20,000
BTC/USD – Daily Chart
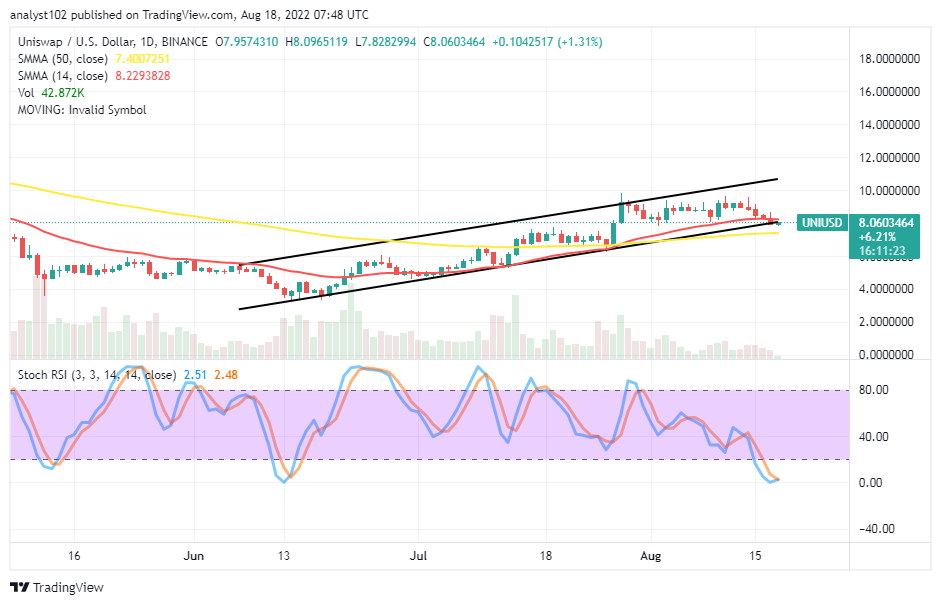
The BTC/USD daily chart showcases that the crypto’s market swings near the line of $35,000, featuring lower lows and lower highs in smaller-length sizes. The critical support baseline is still drawn at the level of $30,000. The Stochastic Oscillators are in the ranges of 40 and 80, posing a promising northbound motion by slightly crossing the lines to the north. The bearish trend-line drew downward to touch the 14-day SMA underneath the 50-day SMA. A smaller bullish candlestick is somewhat beefing up around the level firstly mentioned. And, if eventually forcefully complete its formation to the upside, then, the crypto market may gradually continue to build upon it.
Will there be a change in the market direction soon as the market swings near $35,000?
A fearful northward push is needed by bulls as the BTC/USD market swings near the level of $35,000. However, it could be difficult to achieve that on a smoothly upside riding force at that level as there are tough barriers already built up there in the recent past. As a result, there could be a pit stop at the level in question. And, that could later on result into lowering the values again if price fails to add on more buying forces.
On the downside, bears still have the chance to resist any further upside movement made in the market towards or around the crucial market level of $35,000. And, the level at $30,000 still validly appears to be the extent that a downward force may be seen through. A further push below it, could in no time cause an ugly trading situation of the downward trend.
BTC/USD 4-hour Chart
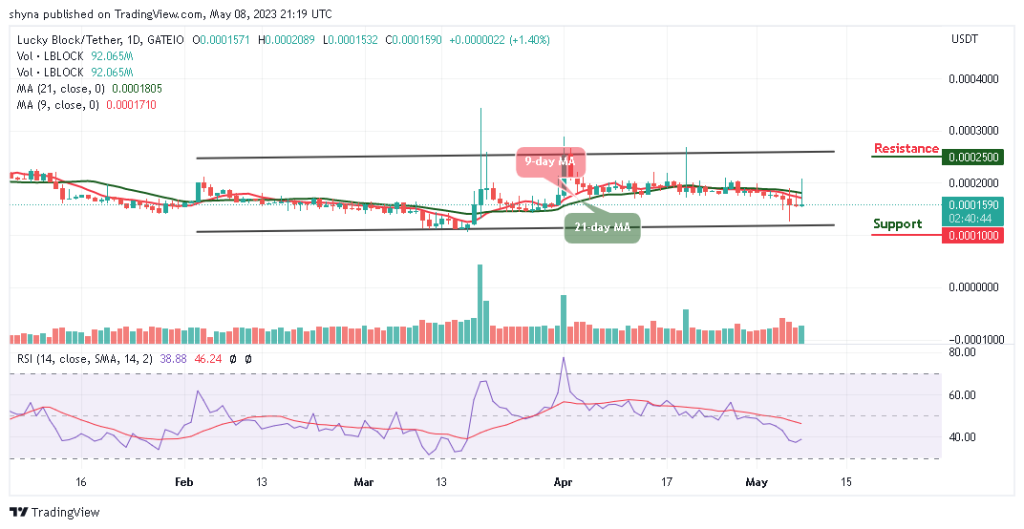
The BTC/USD medium-term chart depicts that the crypto market swings between the two major values of $35,000 and $32,500. All the SMAs are also kept in the range-bound zones. The 50-day SMA indicator is closely over the 14-day SMA indicator. The Stochastic Oscillators are in the overbought region with a slight-cross of the lines southbound, portending that there may soon be a drawdown in the crypto economy. Therefore, any further buying situation in this market could be suspended for a while.
Note: new.cryptosignals.org is not a financial advisor. Do your research before investing your funds in any financial asset or presented product or event. We are not responsible for your investing results.
You can purchase crypto coins here. Buy Tokens