Bitcoin (BTC/USD) Market Trades Below $25,000
Estimated Reading Time: 3 minutes
Don’t invest unless you’re prepared to lose all the money you invest. This is a high-risk investment and you are unlikely to be protected if something goes wrong. Take 2 minutes to learn more

Free Crypto Signals Channel
Bitcoin Price Prediction – August 17
There has been a prolongation of business activities in the BTC/USD trade in defined range-bound zones as the crypto market trades below the psychological $25,000 resistance line after a short-lived smaller push that occurred recently. In the last several hours back into today’s session, the price trades between $24,048.13 and $23,832.75 at a minute of 0.49% positive.
BTC/USD Market
Key Levels:
Resistance levels: $25,000, $27,500, $30,000
Support levels: $20,000, $17,500, $15,000
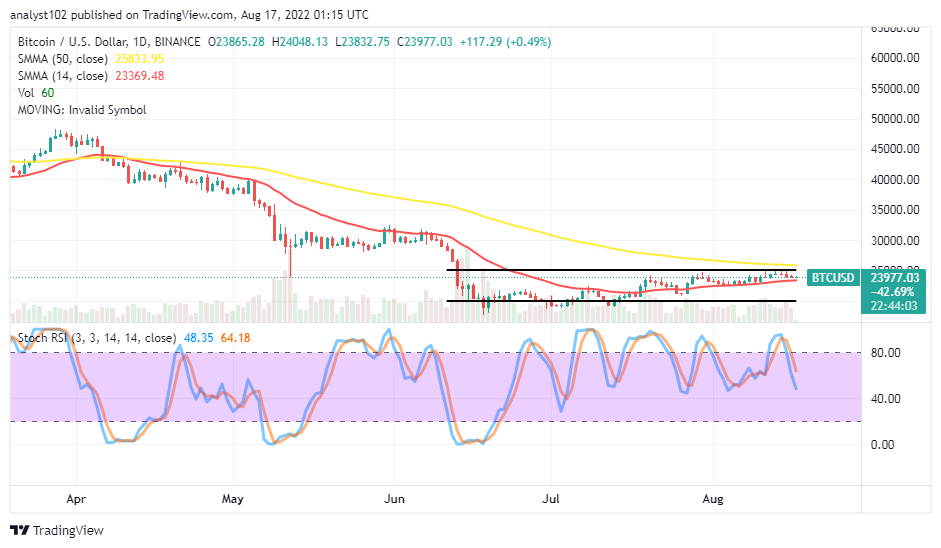
BTC/USD – Daily Chart
The BTC/USD daily chart reveals the crypto market trades below the $25,000 resistance level. The 50-day SMA indicator is at $25,833.95 above the 14-day SMA indicator, which is at $23,369.48. As it is been relevant under the current technical analytics write-up, the upper horizontal line remains drawn at the value resistance line mentioned earlier, and the lower horizontal line is drawn at the $20,000 support level. The Stochastic oscillators have crossed southbound to reach 64.18 and 48.35 range points, still pointing toward the south direction.
Should traders keep looking to get entries at the upper and lower range spots in the BTC/USD market?
There seems necessary that the BTC/USD price traders should keep looking for entries at either the upper or the lower horizontal trading zone before executing an order as the crypto market trades below the $25,000 resistance level. Buyers need to be wary of jumping into the motion that suddenly appears with a weak force to break out at the value line. Their mustering of energy can re-launch after some pull-downs may have allowed materializing around or below the 14-day SMA, coupling with a sign of active rebounds before getting a decent re-buying moment afterward.
On the downside of the technical analysis, the BTC/USD market bears may have to concentrate on staging their resurface around the trading area of the upper horizontal line for execution. They should avoid late selling execution orders as the market poses an outlook of resorting to an unprecedented rebound that can cause a threat to a smooth downward-trending move.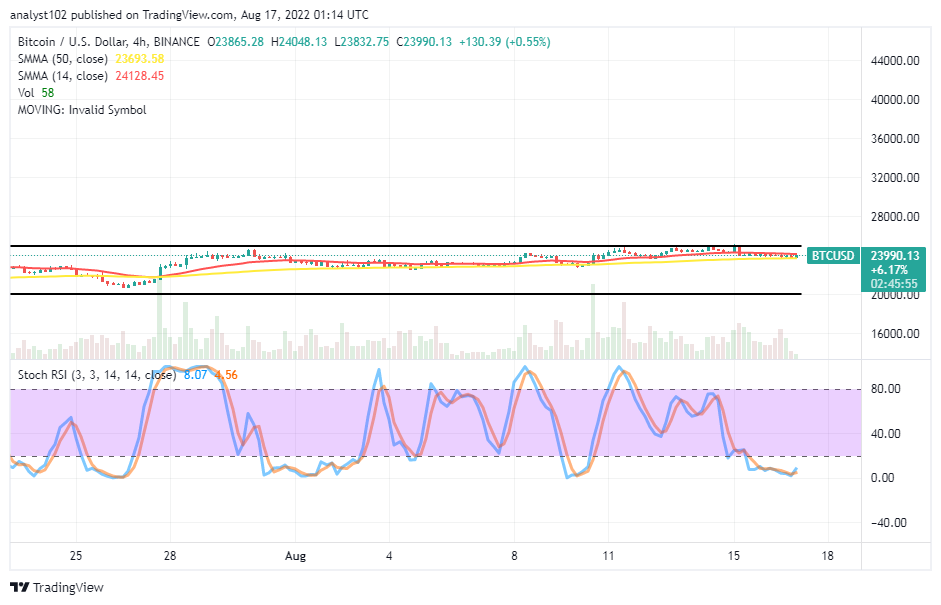
BTC/USD 4-hour Chart
The BTC/USD medium-term chart shows the crypto market trades below $25,000, maintaining the long-range-bound spots. The upper horizontal line remains drawn at the value line earlier mentioned, and the lower horizontal line drew at the $20,000 support level. The 14-day SMA is tightly above the 50-day SMA. And they are near the upper range zone. The Stochastic Oscillators have penetrated the oversold region, keeping 8.07 and 4.56 range values within. They have conjoined their lines toward pointing in the northbound direction in a promissory mode.
Note: Cryptosignals.org is not a financial advisor. Do your research before investing your funds in any financial asset or presented product or event. We are not responsible for your investing results.
You can purchase Lucky Block here. Buy LBLOCK