Bitcoin (BTC/USD) Market Witnesses a Sharp Drawdown
Estimated Reading Time: 3 minutes
Don’t invest unless you’re prepared to lose all the money you invest. This is a high-risk investment and you are unlikely to be protected if something goes wrong. Take 2 minutes to learn more
Bitcoin Price Prediction – September 8
The BTC/USD market witnesses a sharp drawdown since yesterday’s trading operations. The crypto-economic rate of percentage is around -1.49, trading at the level of $46,834. That shows that the downward force is still relatively making an impact on the market until the present.
BTC/USD Market
Key Levels:
Resistance levels: $50,000, $52,500, $55,000
Support levels: $45,000, $42,500, $40,000,
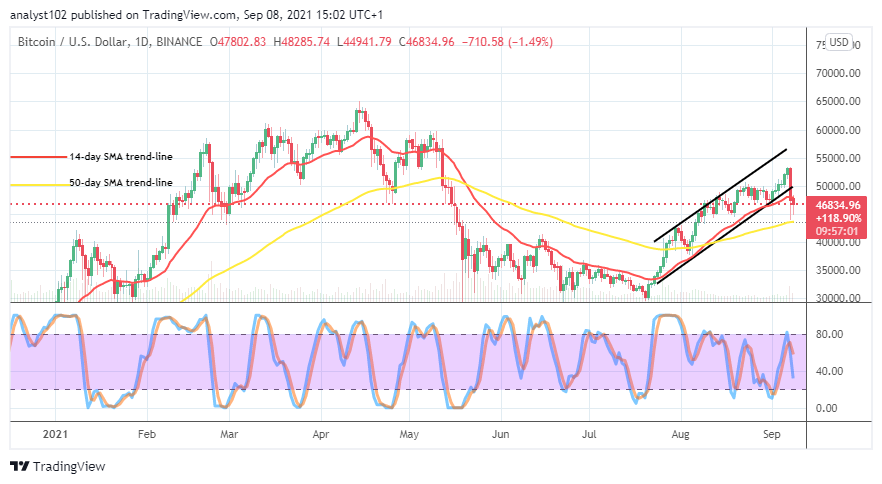
BTC/USD – Daily Chart
The BTC/USD daily chart depicts that the crypto market witnesses a sharp drawdown during yesterday’s session. A bearish candlestick emerged to engulf some bullish candlesticks as the smaller SMA breached southward extensively to average the bigger SMA indicator at the lower zone. Despite all that, the lower bullish channel trend-line remains drawn alongside the 14-day SMA trend-line above the 50-day SMA trend-line. The Stochastic Oscillators have crossed southbound with the blue line, extending slightly past the range of 40. It appears that the depression on the market is somewhat still on.
As the BTC/USD market sees a sharp drawdown, when will the market recover its lost momentum?
Recovery of lost momentum in this kind of trading situation as the BTC/USD market witnesses a sharp drawdown may take a while. Bulls needed to allow some degrees of further southward pushes to get fully exhausted at their lower trading lines before launching of long positions can be considered. In that sense, a lot of patience will have to exercise by traders. The market level at $45,000 seems to be the vital line where support efforts have to build for the market to swing back northward.
A fearful sustainable breakdown of the $45,000 will likely portend strong confirmation of a downward trend returning. $50,000 line is the tough resistance trading line the BTC/USD market bears may find decent reentry sell position if price lacks the energy to breach beyond it to the north. The interception of the 50-day SMA by the 14-day SMA appears not achievable in the near time to further add to the bearish trend resumption at this point.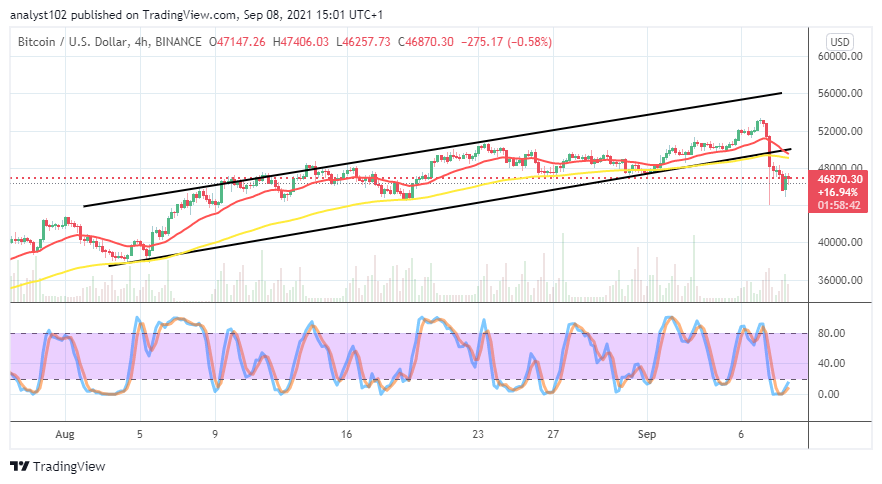
BTC/USD 4-hour Chart
The BTC/USD 4-hour chart also depicts that the crypto market witnesses a sharp drawdown, leading to the southward breakdown of the indicators. The 14-day SMA trend-line has briefly bent southward across the lower bullish channel trend-line drew in support around the 50-day SMA indicator. The Stochastic Oscillators seem, attempting to cross the lines northbound at the touch of range 0 in the oversold region. That suggests that the downward force may soon come to an end.
Note: Cryptosignals.org is not a financial advisor. Do your research before investing your funds in any financial asset or presented product or event. We are not responsible for your investing results.
You can purchase crypto coins here. Buy Tokens