Bitcoin (BTC/USD) Price Appreciates Beneath $45,000 Resistance
Estimated Reading Time: 3 minutes
Don’t invest unless you’re prepared to lose all the money you invest. This is a high-risk investment and you are unlikely to be protected if something goes wrong. Take 2 minutes to learn more

Free Crypto Signals Channel
Bitcoin Price Prediction – March 9
There have been other rounds of witnessing a fall in the BTC/USD market operations in the recent past. Presently the crypto-economic price appreciates beneath the $45,000 trading line. The trading activities are taking place between the high and the low of $2,558 $38,668 as it keeps an average of 9.00% positives.
BTC/USD Market
Key Levels:
Resistance levels: $45,000, $47,500, $50,000
Support levels: $42,500, $40,000, $37,500
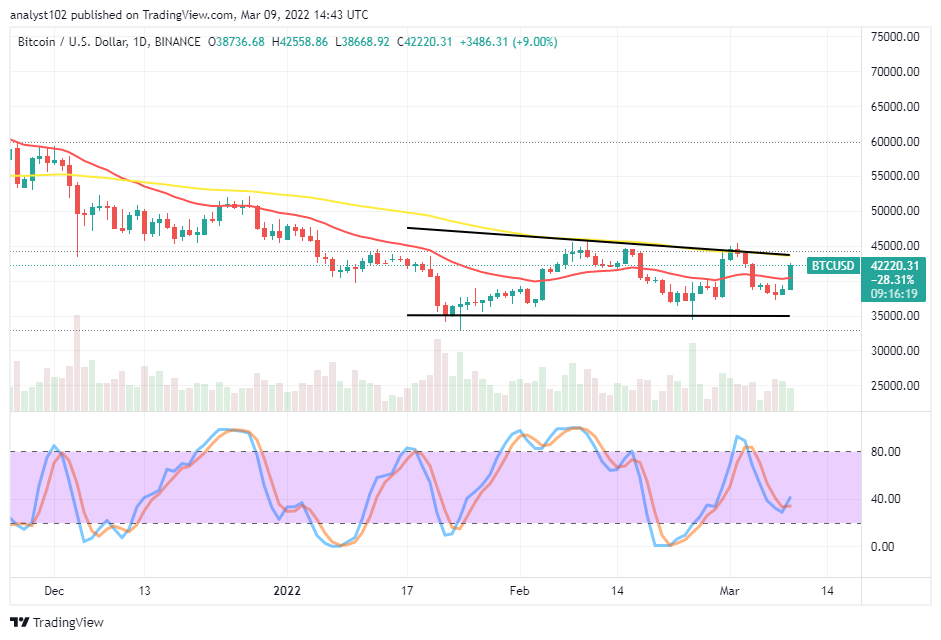
BTC/USD – Daily Chart
The BTC/USD daily chart showcases the crypto-economic price appreciates beneath the $45,000 against the US Dollar currency purchasing power in the crypto business space presently. In the meantime, the triangular descending pattern still maintained as the 50-day SMA indicator trends alongside the bearish trend line drew above the 14-day SMA indicator. The Stochastic Oscillators have crossed their lines northbound at the range at 40 in a manner, portending lagging posture. A bullish candlestick is in the making, attempting to erase the bearish forces that inflicted on the market during the last March 4 trading sessions.
Will the current bullish candlestick in the making propel the BTC/USD market operations for higher profits as the crypto-economic price appreciates beneath $45,000?
Presently, the situation yet shows that bulls have been dominating the market trend in the BTC/USD market operations as the crypto-economic price appreciates beneath the $45,000 resistance level. Therefore, there can be more ups in the next few days. And, if that assumption plays out, the trend may obtain full-fledged trading exhaustion between the value line mentioned earlier and another higher resistance at $47,500 in the long-term run.
On the downside of the technical analysis, the BTC/USD market short-position placers will have to exercise patience until a daily candlestick formed bearish around a higher resistance trading spot before considering getting a decent sell entry. An abnormal bounce-off may surface based on the outlook positioning of the Stochastic Oscillators at the range of 40 as they point north side. They have to turn against the current direction needed in a suggestion suitable to determine a return of a falling force in the crypto economy’s bearish trading cycle.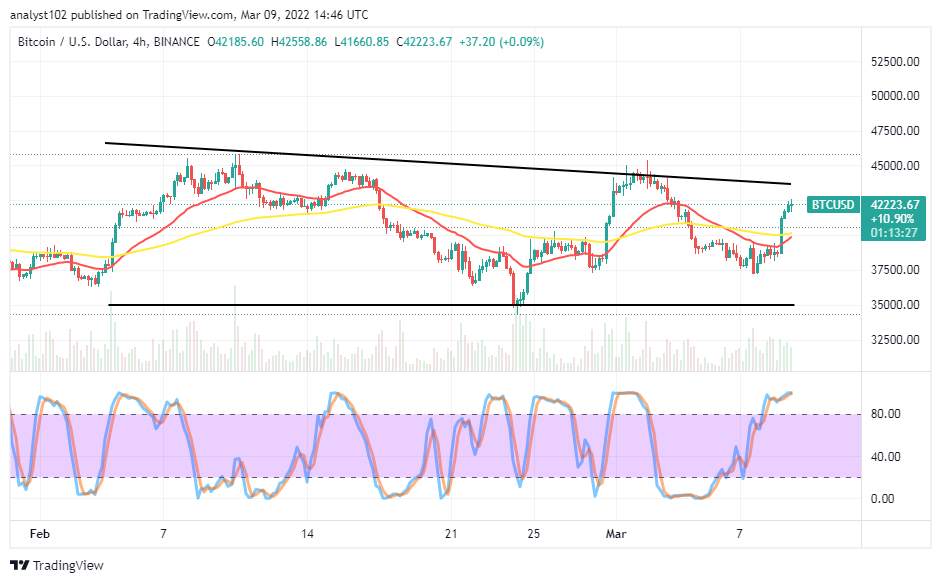
BTC/USD 4-hour Chart
The BTC/USD medium-term chart exhibits the crypto-economic price appreciates beneath the $45,000 resistance trading level. The 14-day SMA indicator has turned northward closer to the 50-day SMA indicator from underneath. A bullish candlestick is beefing up in strength toward the bearish trend line drawn above the SMAs. The Stochastic Oscillators are in the overbought region, seemingly moving in a consolidation style to denote that upward pressure is ongoing. The situation tends to lose the momentum around $45,000 once again if the price keeps inability to sustain the upward pushes as it did in the previous sessions after achieving a higher level to the point.
Note: Cryptosignals.org is not a financial advisor. Do your research before investing your funds in any financial asset or presented product or event. We are not responsible for your investing results.
You can purchase Lucky Block here. Buy LBlock: