Bitcoin (BTC/USD) Price Attempts to Prolong Range Moves
Estimated Reading Time: 3 minutes
Don’t invest unless you’re prepared to lose all the money you invest. This is a high-risk investment and you are unlikely to be protected if something goes wrong. Take 2 minutes to learn more

Free Crypto Signals Channel
Bitcoin Price Prediction – July 13
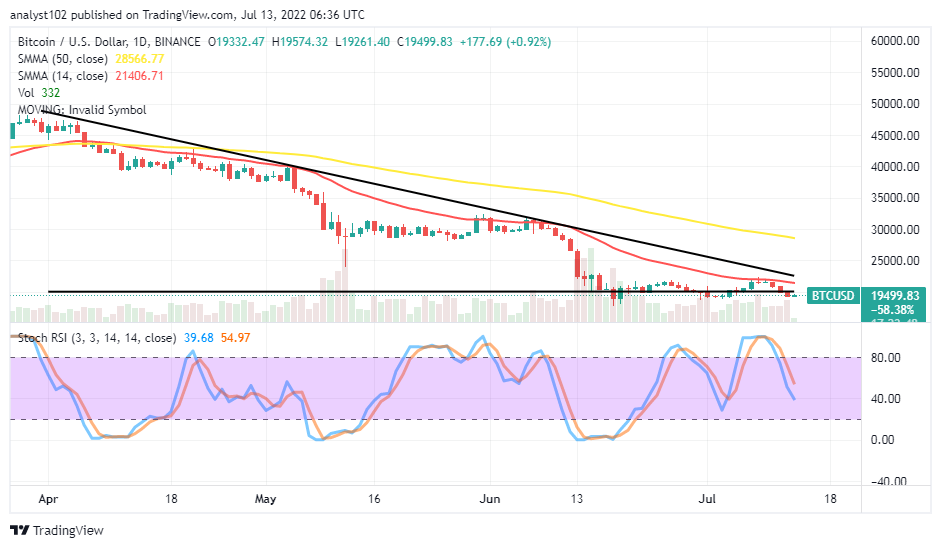
The BTC/USD market price attempts to prolong ranging moves around the $20,000 psychological as it has been over time. Bitcoin’s value is trading between the high and low values of $19,574 and $19,261 at a minute rate of 0.92 percent positive.
BTC/USD Market
Key Levels:
Resistance levels: $22,500, $25,000, $27,500
Support levels: $17,500, $15,000, $12,500
BTC/USD – Daily Chart
The BTC/USD daily chart showcases the crypto-economic price attempts prolonging range moves around the logical trading spot at the $20,000 level as indicated by the horizontal line. The 14-day SMA indicator poses a resistance point at around $21,406 over the value line underneath the 50-day SMA indicator. The Stochastic oscillators have crossed southbound from the overbought region to reach the range of 20. And they are still pointing toward the south direction.
Will there be sustainable downs below the $20,000 in the BTC/USD market afterward?
As the BTC/USD price attempts prolonging range moves around the $20,000 logical trading level, there can be sustainable downs below the value line in the crypto market afterward. That can be intense if bulls fail to make a comeback to safeguard against any possible fearful breakdown through variant support values underneath the same point mentioned. While that assumption tends to play out, long-position takers should be cautious of launching a buying order to avoid the unnecessary whipsawed-trading condition.
On the downside of the technical analysis, as of writing, a smaller bullish candlestick is in the process of beefing closely underneath the $20,000 logical level to suggest a warning against getting a better signal for a sell order. Therefore, it will be technically inclined for the short-position takers to exercise patience until the price hits a rejection point that can cause visible responses toward going back into a correction.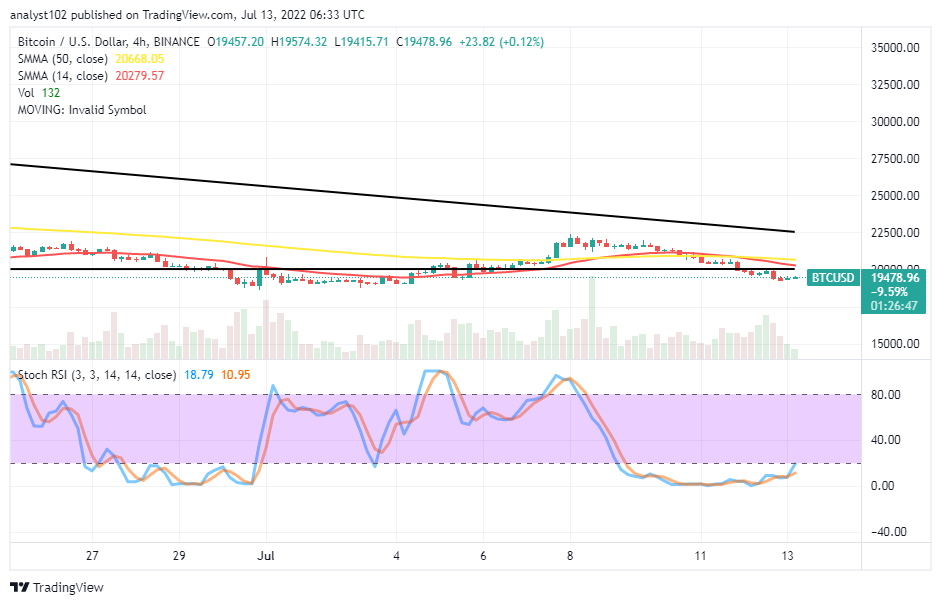
BTC/USD 4-hour Chart
The BTC/USD medium-term chart showcases the crypto market price attempts to prolong range moves around the $20,000 technical trading spot. The 14-day SMA indicator has crossed southward slightly past the 50-day SMA indicator closely over the horizontal line drawn at the value line. The Stochastic Oscillators are in the oversold region, moving in a consolidation manner. And they are now seemingly trying to cross northbound, near below the 20 range. That shows buyers are relatively waking up against declining force at the moment.
Note: Cryptosignals.org is not a financial advisor. Do your research before investing your funds in any financial asset or presented product or event. We are not responsible for your investing results.
“Lucky is up more than 50% today but still more than 430% from All Time Highs!
The opportunity to bank BIG is now!
You can purchase Lucky Block here. Buy LBlock