Basic Attention Token (BATUSD) Bull Market to Issue From $0.208
Estimated Reading Time: 3 minutes
Don’t invest unless you’re prepared to lose all the money you invest. This is a high-risk investment and you are unlikely to be protected if something goes wrong. Take 2 minutes to learn more
A very aggressive bear market was suspended at the $0.216 price level on March 11, when traders found the price level a comfortable point to go long. From that price level, we saw a very progressive Basic Attention Token bull market that continued for the rest of March and later peaked on April 5 at the $0.35 price level. Then again, the bear market was awakened on the same April 5. However, relentless bullish activities in the market have slowed the bear market from reaching the psychological price mark of $0.208.
BAT/USD Price Statistics
- BAT/USD Price Now: $0.224
- BAT/USD Market Cap: $335,165,479
- BAT/USD Circulating Supply: 1,489,010,445
- BAT/USD Total Supply: 1,500,000,000
- BAT/USD CoinMarketCap Ranking: #101
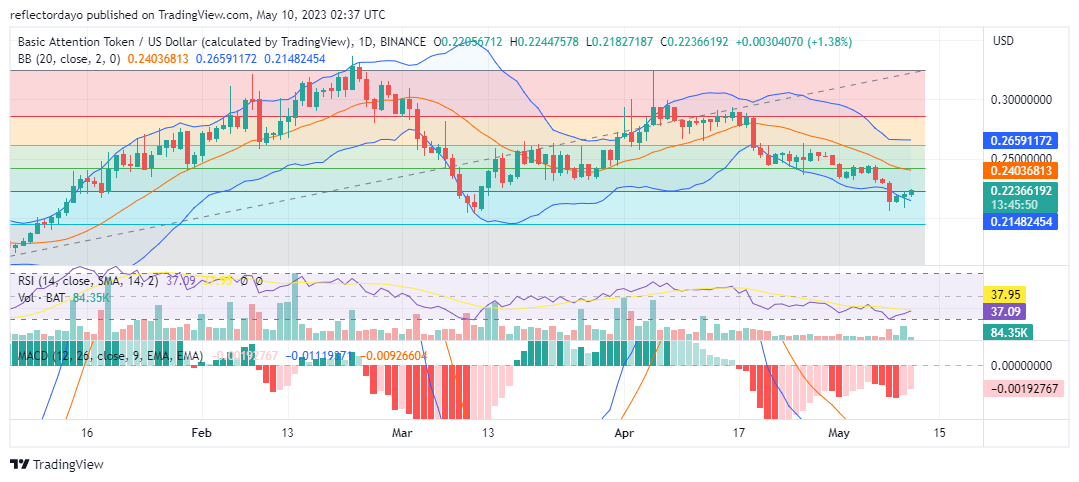
Key Levels
- Resistance: $0.24, $0.25, and $0.26
- Support: $0.21, $0.20, and $0.19
Price Prediction for Basic Attention Token: The Indicators’ Point of View
The $0.208 price level is the psychological price mark; therefore, the market is expected to rally from this level. Also, the market movement that will issue from this price level might have a one-sided performance as the majority of traders are expected to enter the bull market. But according to the Bollinger Bands indicator, the volatility is still on the high side due to the recent bearish move that took the market to the key support level. Looking at today’s market so far, the liquidity in the bear market is gradually fading as the bull market is gaining traction. However, the general volume of trade is still low, and this could be the reason why the uptrend remains a bit conservative. Despite that, the market is set for upward action.
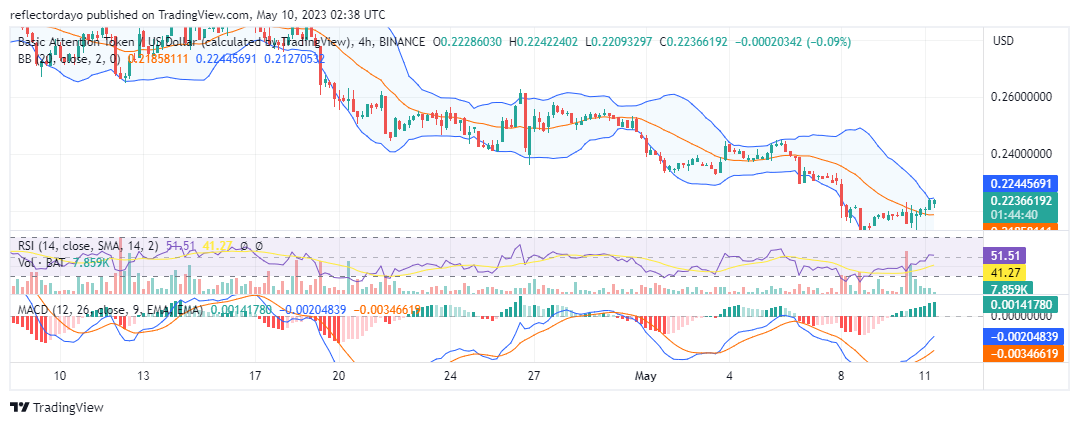
BAT/USD 4-Hour Chart Outlook: Bullish Recovery in Progress
From a 4-hour chart perspective, we can observe a very progressive bullish market recovery. The three indicators used for this analysis maintain bullish sentiment. The Moving Average Convergence and Divergence (MACD) indicator has very progressive bullish histograms, but the two lines are still below zero, trying to rally out from the far lower level. Those lines have gone that far due to the long period of the bearish trend. But in the Bollinger Bands and the Relative Strength Index, we noticed that the market may be experiencing a bit of resistance around its current bullish price level. The low volume of trade may also be contributing to the resistance.