XRP Oscillates In A Range As It Fails To Break Above $0.62
Estimated Reading Time: 2 minutes
Don’t invest unless you’re prepared to lose all the money you invest. This is a high-risk investment and you are unlikely to be protected if something goes wrong. Take 2 minutes to learn more

XRP (XRP) Long-Term Analysis: Ranging
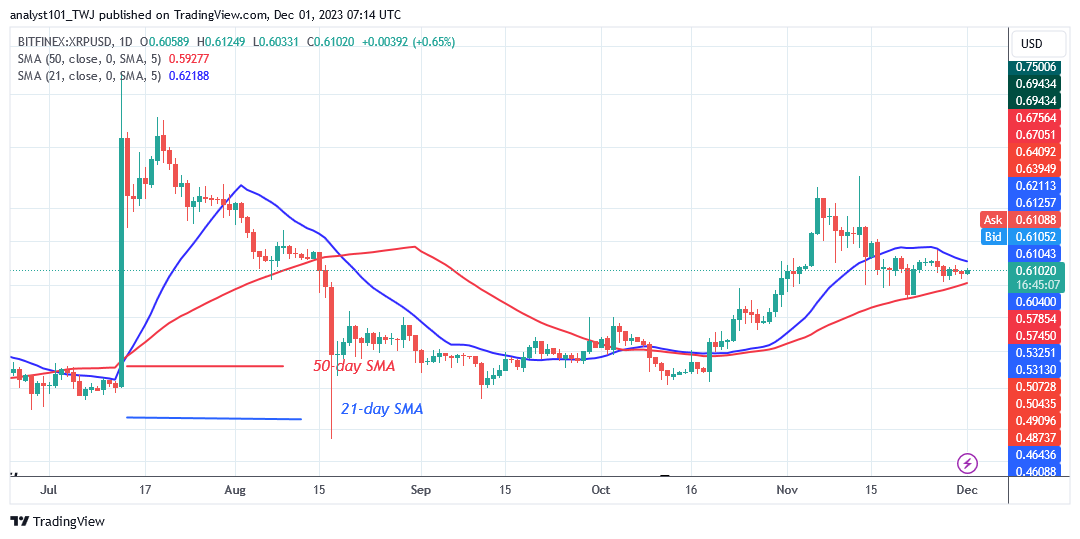
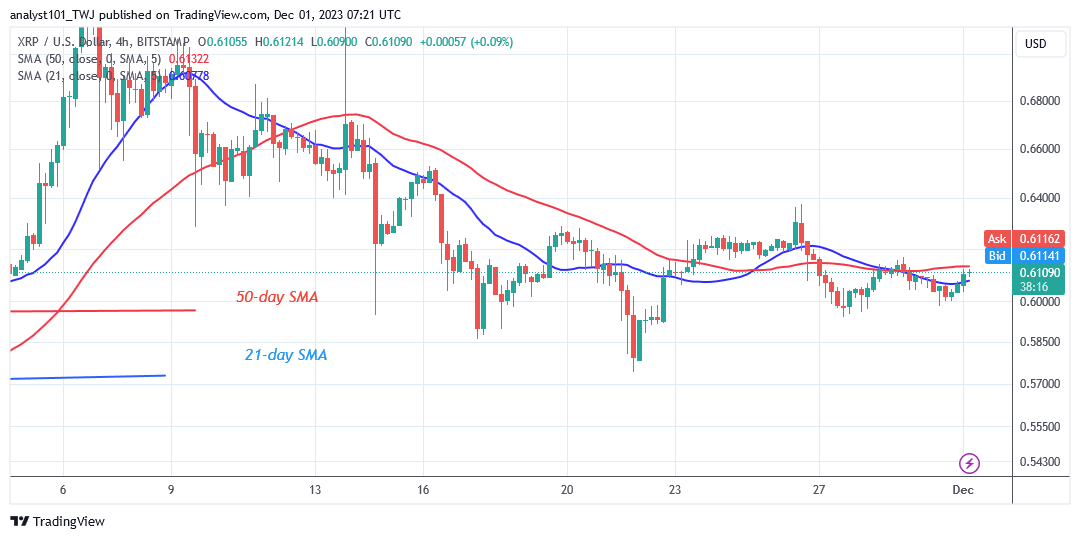
The price of XRP (XRP) has been oscillating between the moving average lines since November 16 as it fails to break above $0.62. The bulls and bears have been working hard for the previous two weeks to break out of the moving average lines. Today, the bulls are attempting to break above the 21-day SMA. A breakout above the 21-day SMA will see XRP rise to a peak of $0.64.
The uptrend will continue to the highs of $0.66 and $0.74. If buyers fail to surpass current resistance levels, XRP/USD risks falling. The market will fall above the $0.54 support level. Currently, the altcoin is trading at $0.62 as of this writing.
Technical Indicators:
Major Resistance Levels – $1.00, $1.50, $2.00
Major Support Levels – $0.50, $0.30, $0.10
XRP (XRP) Indicator Analysis
The price bars of XRP are moving slowly between the moving average lines. Doji candlesticks dominate the price action, making it impossible for prices to break out of the moving average lines. The moving average lines have moved horizontally as a result of the candlesticks.
What Is the Next Direction for XRP (XRP)?
Following the price drop on November 16, the crypto asset is in a horizontal trend as it fails to break above $0.62. The altcoin is now trading in a range between $0.58 and $0.64. When the barrier levels are breached, the altcoin will resume trending. The increasing trend has come to a halt at the high of $0.62. The market will then resume oscillating between the moving average lines because of the rejection.
You can purchase crypto coins here. Buy LBLOCK
Note: Cryptosignals.org is not a financial advisor. Do your research before investing your funds in any financial asset or presented product or event. We are not responsible for your investing results