Lucky Block Price Prediction: LBLOCK/USD Crosses Above $0.0011 Level
Estimated Reading Time: 3 minutes
Don’t invest unless you’re prepared to lose all the money you invest. This is a high-risk investment and you are unlikely to be protected if something goes wrong. Take 2 minutes to learn more

Free Crypto Signals Channel
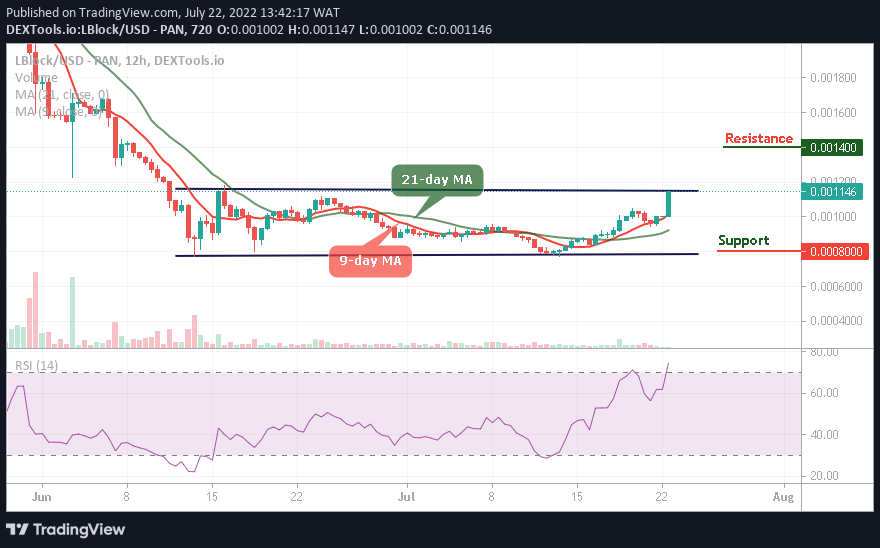
According to the chart, the Lucky Block price prediction shows that LBLOCK would rise above the 9upper boundary of the channel.
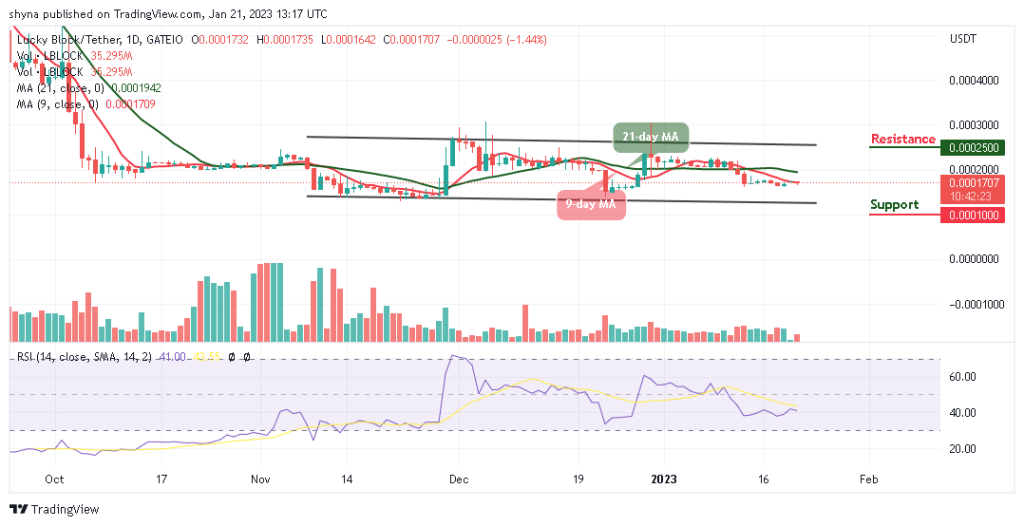
LBLOCK/USD Medium-term Trend: Ranging (12H Chart)
Key Levels:
Resistance levels: $0.0014, $0.0016, $0.0018
Support levels: $0.0008, $0.0006, $0.0004
LBLOCK/USD is crossing above the 9-day and 21-day moving averages as the coin creates additional gains. However, the bullish movement is resuming back into the market as bulls push the coin towards the resistance level of $0.0012.
Lucky Block Price Prediction: LBLOCK/USD Moves Bullishly
The Lucky Block price is hovering at $0.0011 where it prepares to reach the resistance level of $0.0012. At the time of writing, the Lucky Block price is heading towards the upper boundary of the channel. If the bulls strengthen and put more pressure, LBLOCK/USD will maintain the positive side and any further bullish movement will locate the potential resistance levels at $0.0014, $0.0016, and $0.0018.
On the contrary, should the coin slides below the 9-day moving averages; it could touch the nearest support at $0.0010. Any bearish movement towards the lower boundary of the channel may locate the critical support levels at $0.0008, $0.0006, and $0.0004. Moreover, the technical indicator Relative Strength Index (14) moves into the overbought region, indicating an increase in the bullish movement.
LBLOCK/USD Medium-term Trend: Bullish (4H Chart)
On the 4-hour chart, the Lucky Block price is hovering above the 9-day and 21-day moving averages with a bullish candle. The technical indicator Relative Strength Index (14) keeps moving above the 60-level.
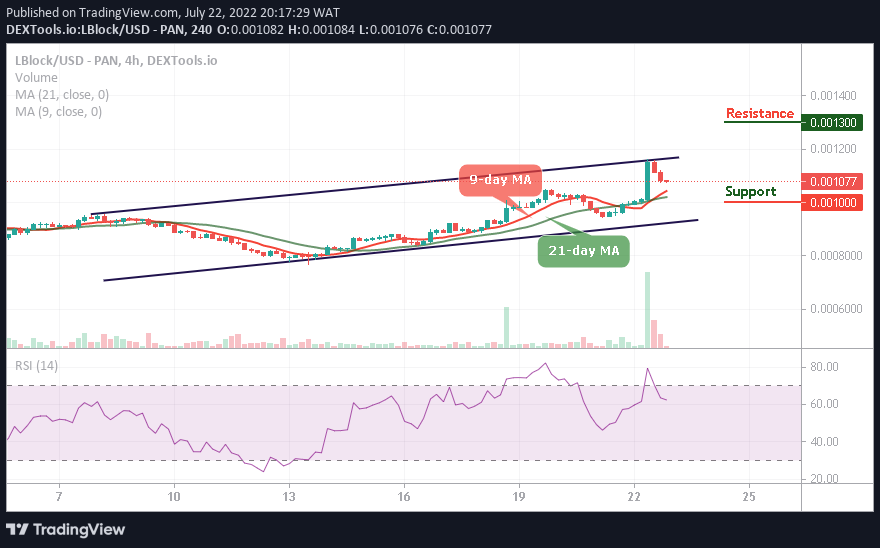
However, any further bullish movement will push LBLOCK/USD above the upper boundary of the channel which will hit the resistance level of $0.0013 and above. On the contrary, if the price drops below the moving averages, it could hit the support at $0.00010 and below, giving new buyers the opportunity to enter the market.
You can purchase Lucky Block here. Buy LBlock