Wall Street Memes (WSM/USD) Trade Climbs, Stirring Strong
Estimated Reading Time: 4 minutes
Don’t invest unless you’re prepared to lose all the money you invest. This is a high-risk investment and you are unlikely to be protected if something goes wrong. Take 2 minutes to learn more

Wall Street Memes Price Prediction – July 4
A continuous positive promissory sign has been staging in the way the WSM market buyers have demonstrated their stances against the market worth of the American dollar, given that the base instrument climbs to make a base around $0.0006, stirring strong moves in the setup.
Lately, there’s been a quiet but growing shift as seasoned WSM/USD market investors steadily increase their presence in key markets, likely expecting an unexpected surge upward. This quiet buildup often appears when price moves become calmer and more compressed. Those betting against the trend might want to stay alert—quick upward moves could unfold suddenly and catch them off guard.
WSM/USD Market
Key Levels
Resistance levels: $0.0007, $0.0008, $0.0009
Support levels: $0.0005, $0.0004, $0.0003
WSM/USD – 4-Hour Chart
The WSM/USD 4-hour chart depicts that the crypto-economic market climbs in positive moves, stirring strong moves at the trade territories of $0.0006.
The Bollinger Bands are delineating key valuation zones where heightened buyer activity is likely to emerge, supporting favorable entry setups within a stabilized volatility framework. Concurrently, the stochastic oscillators remain confined within a positive range, indicating sustained bullish pressure and reinforcing the market’s underlying structural strength.
Can Price Activity Around $0.0006 Shape the Next Phase of WSM/USD Movement?
It may take some time before the WSM/USD market builds sufficient momentum to advance further above the $0.0006 level, allowing prospective long-term investors to position gradually ahead of any potential rebound as the price climbs, stirring strong moves in the low, feeble pricing activity proceedings.
The WSM/USD market operation is yet signaling a bullish realignment as valuation steadies near the $0.0006 threshold, indicating a reinforced accumulation zone. Strength metrics are gradually skewing toward demand-side dominance, with diminished bearish inertia pointing to a shift toward persistent upward drive. The tightening price corridor reveals underlying ascent potential, as increasing order flow and sentiment recovery suggest a formative upward cycle. With core support layers firming and market engagement expanding, conditions appear favorable for a constructive breakout phase.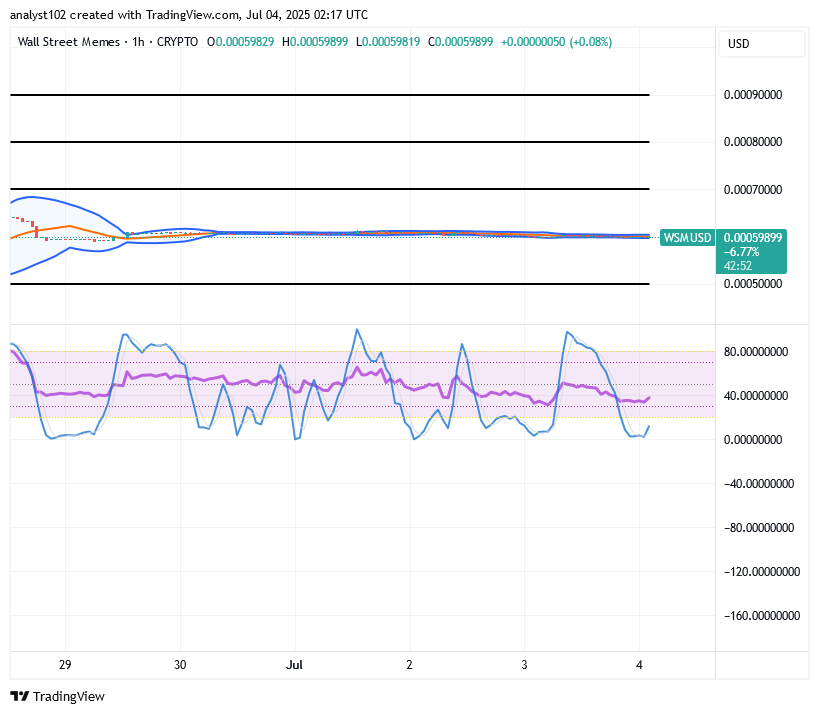
WSM/USD 1-Hour Chart
The 1-hour chart, as of this analytics ‘write-up, has it that the WSM/USD market climbs higher in its ranging movements, stirring strong moves.
The stochastic oscillators have been persistently oscillating across upward and retracement phases, signaling a gradual intensification of bullish momentum and a developing directional bias. Concurrently, the Bollinger Bands remain tightly constricted and laterally aligned around the $0.0006 threshold, reflecting a suppressed volatility regime. This sustained compression phase indicates latent price pressure, typically foreshadowing a high-probability breakout scenario.
$WSM / $USDT is now officially tradeable on #Bybit Perpetuals with enhanced market exposure.
Trade here: https://i.bybit.com/1Wab4K3z
$WSM community, we saw your Tweets! 👏$WSM / $USDT is now tradeable on #Bybit Perpetuals.
— Bybit (@Bybit_Official) October 13, 2023
Trade here: https://t.co/le4XyVyXaZ
Also want your project listed? Share your suggestions here:https://t.co/W7EWJVVNV5 https://t.co/XgXoL7g0rF
Buy and stake WSM now! https://wallstmemes.com/