Bitcoin (BTC/USD) Price Fluctuates Close to $50,000
Estimated Reading Time: 3 minutes
Don’t invest unless you’re prepared to lose all the money you invest. This is a high-risk investment and you are unlikely to be protected if something goes wrong. Take 2 minutes to learn more
Bitcoin Price Prediction – August 30
The BTC/USD price fluctuates close to the level at $50,000. Variant trading activities have been between the crypto’s valuation and the US Dollar over time around that line. The market’s trading rate is around -1.87 percent, as the price trades at the level of $48,545 as of writing.
BTC/USD Market
Key Levels:
Resistance levels: $52,500, $55,000, $57,500,
Support levels: $45,000, $42,500, $40,000
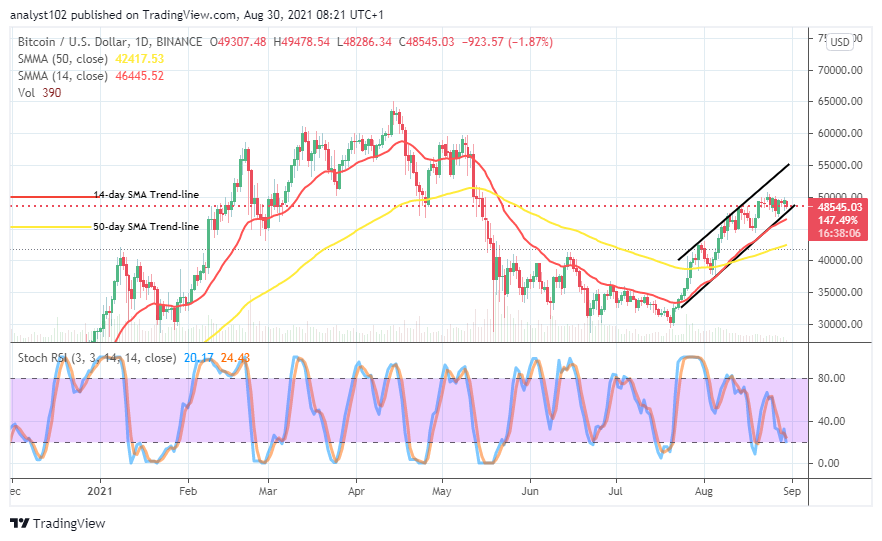
BTC/USD – Daily Chart
The BTC/USD daily chart reveals that the crypto’s price fluctuates around close to the trading line at $50,000. And, it appears that the long-stationing barrier at that level is yet to breach northwardly. The 14-day SMA trend-line appears strongly, extending to the north side above the 50-day SMA trend-line. The bullish channel trend lines remain the tool embodying most recent trading positions that feature until the present. The Stochastic Oscillators have gently traveled southbound to locate a place around the range of 20. It signifies the possibility of seeing the market making a swing in the near time.
Will there be a continued less active motion in the BTC/USD market operation as price fluctuates close to $50,000?
There may still be some downward motions in the BTC/ USD market operations as the price fluctuates close to $50,000 before a support line by bulls. In a less-active motion, lower lines close to or around the level at $47,500 may revisit by price to probably allow the re-building of supports for bulls. The trending past of $45,000 by the 14-day SMA indicator made the point to market the maximum lower-point that price may retrace in a worst downward motion scenario.
On the downside, in the first place, Stochastic Oscillators have indicated that energy needed by the BTC/USD market bears isn’t weighty enough to back up a sell signal, indicating southward price movement that may emanate at the current trading line of the crypto economy. 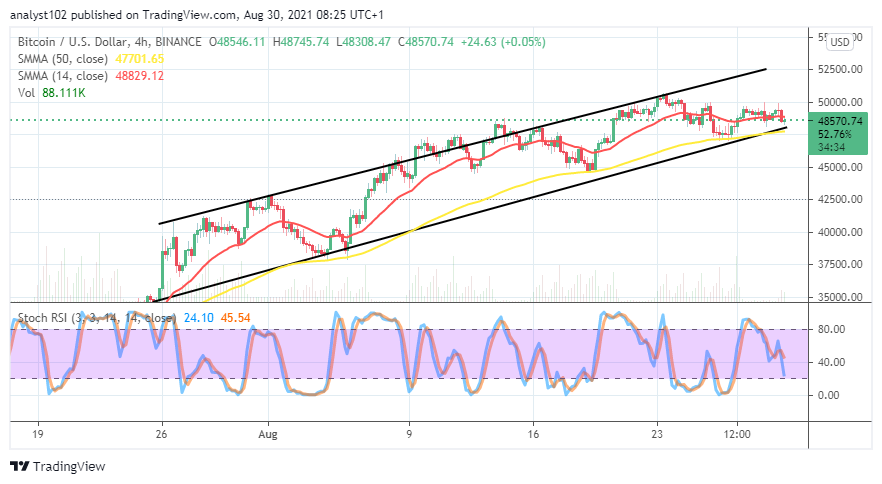
BTC/USD 4-hour Chart
The BTC/USD 4-hour chart reveals that the crypto’s price fluctuates close to the trend lines of both the bigger SMA and the lower bullish channel. The 50-day indicator and the lower bullish channel trend-line are closely around $47,500 below the 14-day SMA indicator. The Stochastic Oscillators have swerved the lines back southbound from the range of 40 down close to the range 20. That indicates that smaller downside pressure is somewhat ongoing. Once there is a rebound from a lower trading zone, the market may have to build northwardly.
Note: Cryptosignals.org is not a financial advisor. Do your research before investing your funds in any financial asset or presented product or event. We are not responsible for your investing results.
You can purchase crypto coins here. Buy Tokens