Litecoin (LTC/USD) Market Fails at $150
Estimated Reading Time: 3 minutes
Don’t invest unless you’re prepared to lose all the money you invest. This is a high-risk investment and you are unlikely to be protected if something goes wrong. Take 2 minutes to learn more
Litecoin Price Prediction – August 3
The LTC/USD market fails to break northward past the level of $150 as price trades around 138. The crypto’s financial book records a negative percentage rate at about 3.24.
LTC/USD Market
Key Levels:
Resistance levels: $150, $200, $250
Support levels: $110, $100, $90
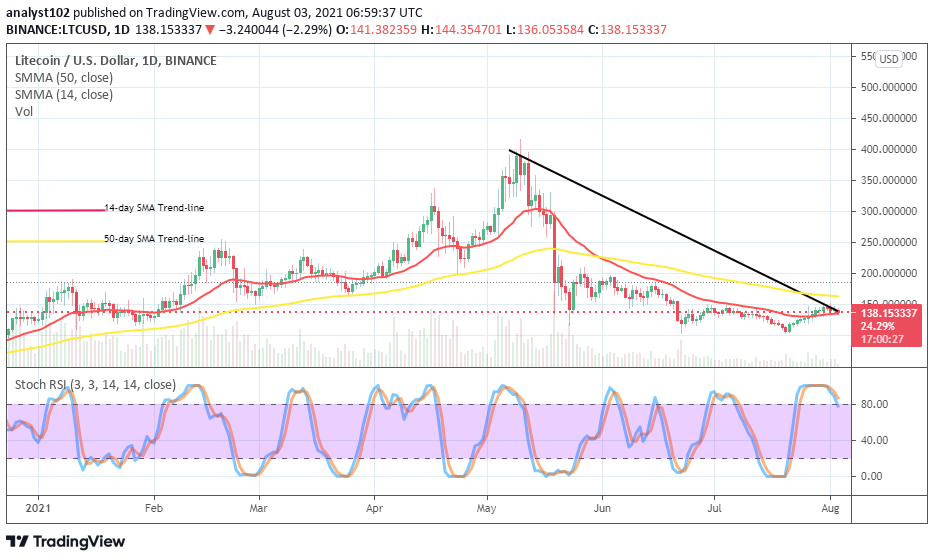
LTC/USD – Daily Chart
It now shows on the LTC/USD daily chart that the crypto market fails at around the line of $150 as the declining motion characterized by smaller-bearish candlesticks close above the buy signal side of the smaller SMA. The 50-day SMA indicator is over the 14-day SMA indicator as the bearish trend-line drew southward across the SMAs to place a markdown close to the end-tail of the smaller SMA trend-line. It shows the market recesses in motion. The Stochastic Oscillators are in the overbought region, with the lines conjoined and now curved southbound near the range of 80. That indicates that a downward force is somewhat imminent.
Would price turn down further as the market fails to break out at $150?
In the first place, it is still noteworthy that the crypto moves in ranges around $150 and $100 as the market fails to break out at $150. Currently, the LTC/USD market bulls’ energy seemingly lacks the action needed to push to the north for sustainability. Based on that assumption, Intending-buying positions hold on for a while until a bullish candlestick emerges against the point earlier mentioned. That said, investors may still consider those zones as one of the best times to join the crypto economy.
On the downside analysis, the present trading situation of the crypto market appears getting set to see more probable downs than ups. As though the motion to the downside may less be active in the ranges mentioned above afterward. The southbound curving posture near the range of 80 backs the imminent downward readings of the market at that trading capacity measure. If bears can intensify their stance in the market, the downward force may see the market southward to the previous lower value around the level of $100.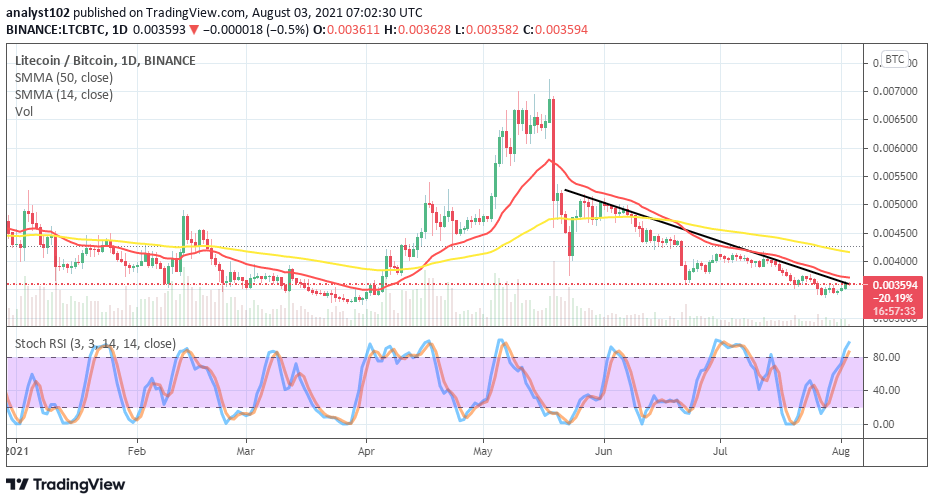
LTC/BTC Price Analysis
The LTC/BTC price analysis chart shows that the trending weight between the two cryptos fails to push forcefully further to the north. The 50-day SMA trend-line is over the 14-day SMA trend-line as the bearish trend-line remains drawn downward alongside the smaller SMA. The Stochastic Oscillators have slightly moved into the overbought region, pointing toward the north direction in it. That suggests that the base crypto is struggling to regain the momentum of the trending catalyst against the flagship counter trading tool.
Note: Cryptosignals.org is not a financial advisor. Do your research before investing your funds in any financial asset or presented product or event. We are not responsible for your investing results.
You can purchase crypto coins here. Buy Tokens