Bitcoin (BTC/USD) Price Moves Between $55,000 and $60,000 Levels
Estimated Reading Time: 3 minutes
Don’t invest unless you’re prepared to lose all the money you invest. This is a high-risk investment and you are unlikely to be protected if something goes wrong. Take 2 minutes to learn more
Bitcoin Price Prediction – April 9
The BTC/USD market valuation continues to trade between the levels of $55,000 and $60,000 about a couple of trading days’ sessions.
BTC/USD Market
Key Levels:
Resistance levels: $65,500, $70,000, $75,000
Support levels: $50,000, $45,000, $40,000
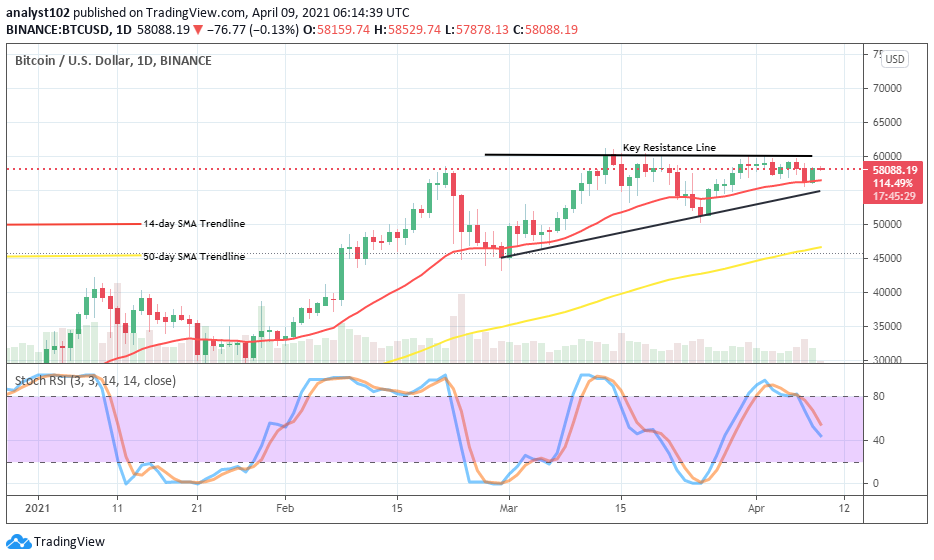
BTC/USD – Daily Chart
The BTC/USD daily trading chart still has the key resistance drawn at the $60,000 level to indicate how crucial it be in the furthering of the crypto’s bullish trend afterward. Both the 14-day SMA trend-line and the bullish trend-line are closely placed underneath the current market trading situation as the 50-day SMA indicator is located below them. The Stochastic Oscillators have slightly moved downward near range 40. And, they now seemingly are attempting to cross the hairs soon. That suggests that an upward move is imminent.
Will the BTC/USD trading outlook remain featuring in between the levels of $55,000 and $60,000?
The present trading position over time needs more active price action to change the direction of the BTC/USD operations. Therefore, more pressures will have to be exerted against the key $60,000 resistance trading line. Meanwhile, the value of $55,000 remains the best support point where the bulls will have to muster up strength in the process of preparing the stance to break northward past the said resistance line.
As regards the downward trading situation of this crypto-economy, the bears may have to be on the lookout for a strong reversal move around the major resistance line of $60,000 before considering a launch of a sell order. Failure to get it at an early stage around that point will let the bears get trapped. As a result, more precautionary measures have to adhere while placing a sell order of trading.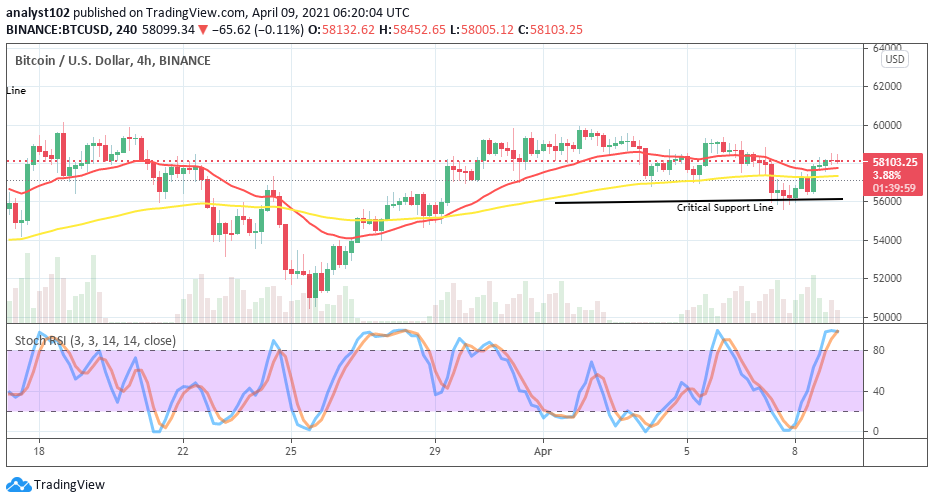
BTC/BTC Price Analysis
There has now been a slight downward break of the SMA trendlines to locate support around the critical trading level of $56,000. In the medium trading outlook, price has rallied briefly against the two SMA trading indicators towards the north. The 14-day SMA is a bit over the 50-day SMA. The Stochastic Oscillators have into the overbought region to close the hairs within it. That could eventually result in consolidation moving formation to suggest a stronghold of the bulls during the session.
Note: cryptosignals.org is not a financial advisor. Do your research before investing your funds in any financial asset or presented product or event. We are not responsible for your investing results