Bitcoin (BTC/USD) Price Swings at the $40,000 Resistance Level
Estimated Reading Time: 3 minutes
Don’t invest unless you’re prepared to lose all the money you invest. This is a high-risk investment and you are unlikely to be protected if something goes wrong. Take 2 minutes to learn more

Free Crypto Signals Channel
Bitcoin Price Prediction – April 24
The BTC/USD market operations show the crypto-economic price swings at the $40,000 resistant trading line. Variant smaller-ups and smaller-downs have featured between $40,022 and $39,415, representing the areas of high and low, keeping a minute positive percentage of 0.41.
BTC/USD Market
Key Levels
Resistance levels: $42,500, $45,000, $47,500
Support levels: $37,500, $35,000, $32,500
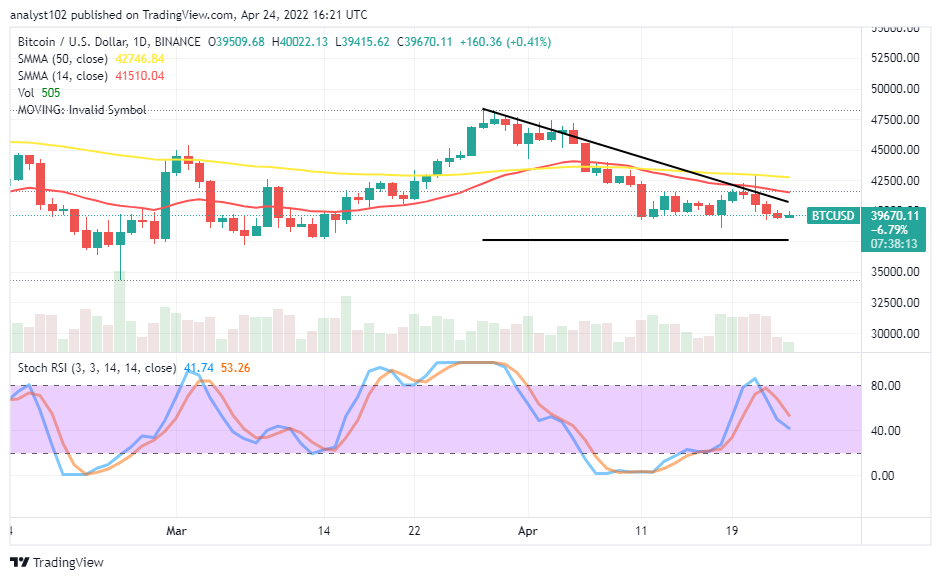
BTC/USD – Daily Chart
The BTC/USD daily chart reveals the crypto-economic price swings at the $40,000 resistance trading level over a couple of sessions. The horizontal line drawn at $37,500 indicates the critical value-line against getting a sustainable downing trend afterward. The 14-day SMA indicator is underneath the 50-day SMA indicator, trying to bend southward closely above the formerly mentioned value-line. The Stochastic Oscillators have moved southbound closer to the range of 40. And they are seemingly attempting to cross back northbound from the range trading spot.
Will the BTC/USD market sellers push the trading point to the $37,500 support level as the crypto-economic price swings at the $40,000 line?
It seems some degrees of indecision will still play out in the BTC/USD market operations for some time as the crypto-economic price swings at the $40,000 trading level. It would be technically inclined to let the market make some moves to the downside closely to a lower support line around the $37,500 to spot any possible rebound from the point before deciding to go for a buying order.
On the downside of the technical analysis, the BTC/USD market short-position placers have to be cautious of launching a new sell order below the $40,000, especially when the price appears to fall freely toward the trading support area of $37,500. Such a move could mean completing a downward force in the descending triangular pattern. A sudden fearful bounce-off against the trend line of the 14-day SMA may put the market in the motion to aim at the previous resistance of around $42,500 afterward.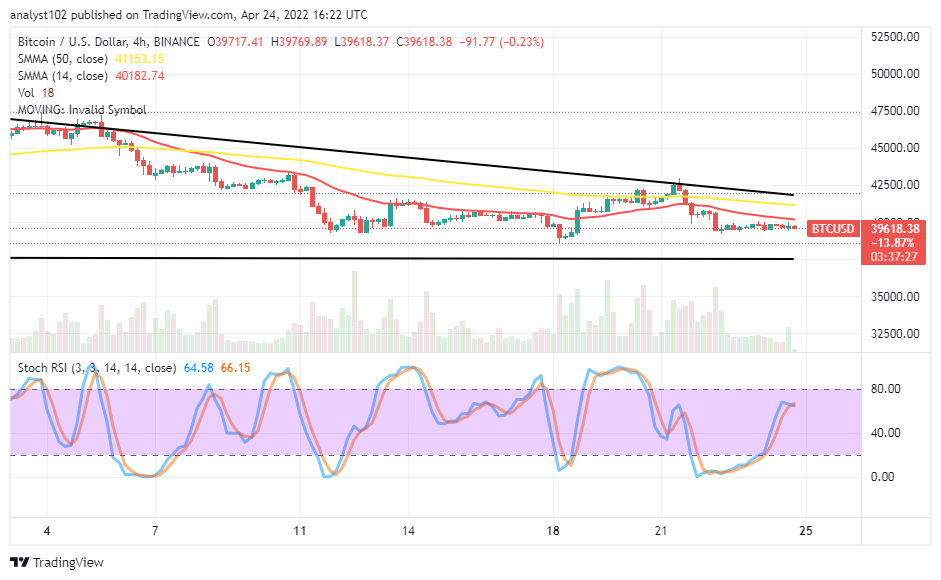
BTC/USD 4-hour Chart
The BTC/USD medium-term chart shows the crypto-economic price swings at the $40,000 resistance. The trading SMA indicators are at the upper locations near beneath the bearish trend line. The 14-day SMA is beneath the 50-day SMA. The Stochastic Oscillators are at a range not far from the 80 range. It appears the pressures to the upside may not uphold firmly based on the current energy pace been beefing by the base trading instrument in the
Note: Cryptosignals.org is not a financial advisor. Do your research before investing your funds in any financial asset or presented product or event. We are not responsible for your investing results.
You can purchase Lucky Block here. Buy LBlock: