Bitcoin (BTC/USD) Price Trades at $62,500
Estimated Reading Time: 3 minutes
Don’t invest unless you’re prepared to lose all the money you invest. This is a high-risk investment and you are unlikely to be protected if something goes wrong. Take 2 minutes to learn more
Bitcoin Price Prediction – October 31
There has been a momentum loss at a higher trading zone as the BTC/USD price trades around the $62,500 level. The crypto market pace is around $61,448 at a smaller negative percentage rate of 0.99.
BTC/USD Market
Key Levels:
Resistance levels: $65,000, $67,500, $70,000
Support levels: $57,500, $55,000, $52,500
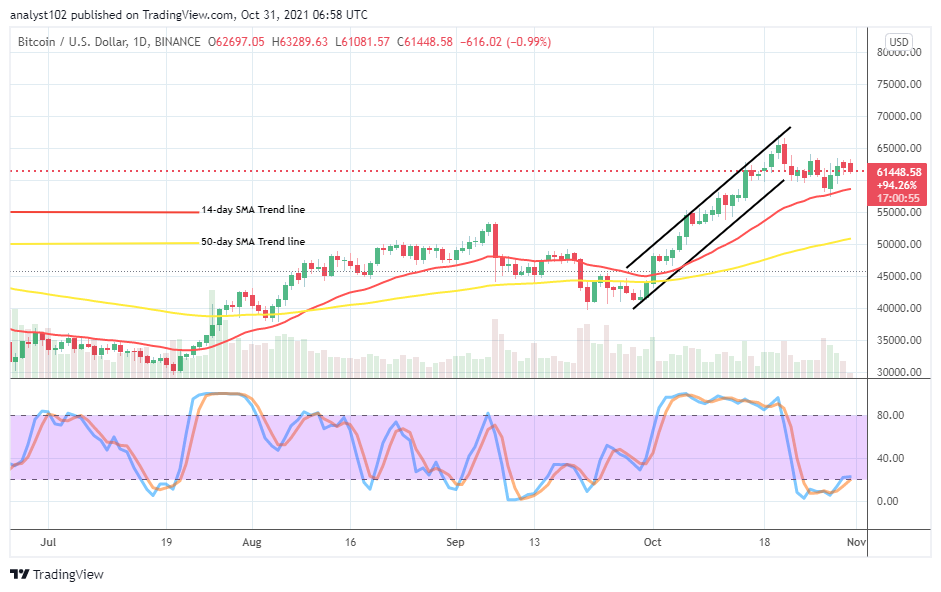
BTC/USD – Daily Chart
The BTC/USD daily chart showcases that the crypto-economic price trades around the level of $62,500 away on the buy signal of the SMAs. Variant candlesticks have continued to feature around the trading zone. The 50-day SMA trend line is underneath the 14-day SMA trend line. The Stochastic Oscillators have closed the lines at range 20. That indicates that the crypto trade may soon lose part of its stances to the downside.
Would it be necessary that the BTC/USD market operation retrace further as price trades at $62,500?
It appears technically necessary that the BTC/USD market operation retraces for a while as the crypto-economic price trades at $62,500. Slight downward pushes are currently ongoing to possibly let the market find back its stance around the trend line of the 14-day SMA. The levels between $57,500 and $55,000 are focus points for major trading activities where support could obtain.
On the downside, there is a need that the trading situation of the BTC/USD price valuation faces an intense resistance around the $62,500 level so that bears will be able to accumulate more energies to push against the upward trend already established. In the situation of heightening a price retracement motion devoid of a rebounding sign against the trend line of the 14-day SMA, it will mean that the crypto is liable to suffer a setback more in its valuation for some sessions.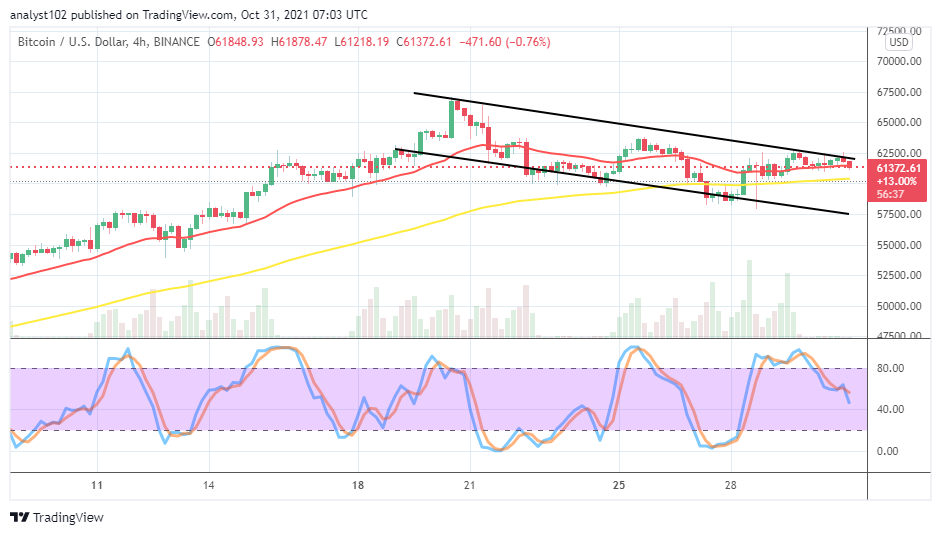
BTC/USD 4-hour Chart
The BTC/USD 4-hour chart shows that the crypto-economic price trades in a retracement moving outlook, showcasing $62,500 and $57,500 as the major value-lines where the movements have been taking place. The 14-day SMA indicator is above the 50-day SMA indicator. The Stochastic Oscillators have slightly bent southbound near over the range of 40. That indicates that the price is somewhat experiencing a lowering process. That can also lead to a re-visit of the previous lower zone before the crypto may get back its momentum.
Note: Cryptosignals.org is not a financial advisor. Do your research before investing your funds in any financial asset or presented product or event. We are not responsible for your investing results.
You can purchase crypto coins here. Buy Tokens