Bitcoin (BTC/USD) Price Trades in Sideways
Estimated Reading Time: 3 minutes
Don’t invest unless you’re prepared to lose all the money you invest. This is a high-risk investment and you are unlikely to be protected if something goes wrong. Take 2 minutes to learn more

Free Crypto Signals Channel
Bitcoin Price Prediction – May 18
It has been that the BTC/USD market price trades sideways over a couple of days’ sessions. The crypto trade keeps a negative percentage trading outlook as it features around $29,781.
BTC/USD Market
Key Levels:
Resistance levels: $32,500, $35,000, $37,500
Support levels: $27,500, $25,000, $22,500
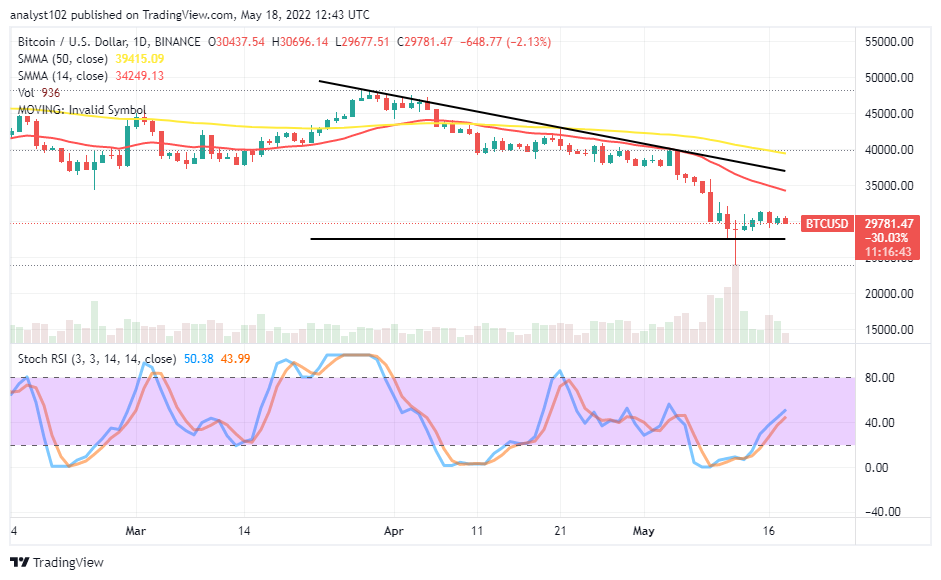
BTC/USD – Daily Chart
The BTC/USD daily chart reveals the crypto-economic market price trades sideways around the $30,000 level. The 14-day SMA trend line is beneath the 50-day SMA trend line. A smaller bearish candlestick is in the making, signaling that a downward force is feebly featuring. The Stochastic Oscillators have bent slantingly northbound, slightly past the range of 40. That shows the market may need to go down, at this point, for a necessary correction.
Will the BTC/USD market stay afloat over the $27,500 support level?
It may be for a while before the BTC/USD market stays far over the $27,500 support level as the crypto-economic price trades sideways around the $30,000 presently. The situation even portends a brighter deal for getting some lows than highs. Buying orders may execute while the market hits support at a lower trading line of the current zone. A fearful rebounding motion may occur against the point to launch bulls back into an upside direction.
On the downside of the technical analysis, the BTC/USD market short-position takers have between the $30,000 and the $32,500 trading zones to stage an early resistant-trading trait against any recuperating efforts that bulls might have to get re-energized from the deep-lower spot in the subsequent activities. In the wake of indecision at this current point, the price will brighten up, moving in a long-term ranging outlook for some time.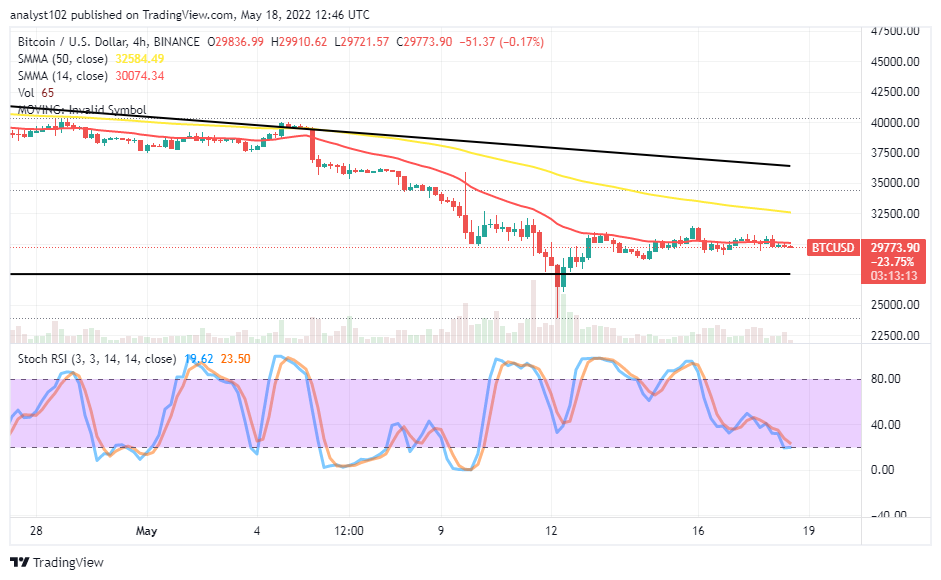
BTC/USD 4-hour Chart
The BTC/USD medium-term chart reveals the crypto’s price trades sideways around the trend line of the smaller SMA. The 50-day SMA indicator is above the 14-day SMA indicator. The bearish trend line drew above all the indicators to picture the vital resistance levels around the $35,000 and the $37,500 value lines. The Stochastic Oscillators are unwittingly swinging to the southbound, touching the lower range line at 20. The burden of falling force on the market is gradually precipitating in its motion. That situation may get heightened to a $27,500 lower point in the next few hours, giving a chance for another round of rebounds.
Note: Cryptosignals.org is not a financial advisor. Do your research before investing your funds in any financial asset or presented product or event. We are not responsible for your investing results.
You can purchase Lucky Block here. Buy LBlock: