Bitcoin (BTC/USD) Sets a Trading-Pace Bottoming Around the $55,000 Support Level
Estimated Reading Time: 3 minutes
Don’t invest unless you’re prepared to lose all the money you invest. This is a high-risk investment and you are unlikely to be protected if something goes wrong. Take 2 minutes to learn more
Bitcoin Price Prediction – April 21
BTC/USD market, in the wake of featuring a line of price correctional movements recently, the pair now finds a vital support baseline to sit on.
BTC/USD Market
Key Levels:
Resistance levels: $60,000, $65,000, $70,000
Support levels: $50,000, $45,000, $40,000
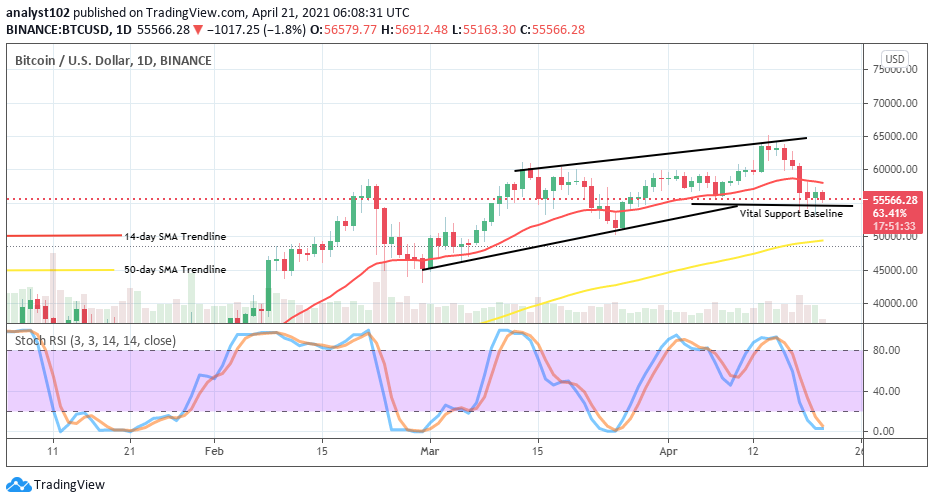
BTC/USD – Daily Chart
It now depicted on the BTC/USD daily trading chart that the current occurrence of variant small-sized candlesticks around the lower bullish channel-line as in no time resulted in giving birth of a vital support baseline around the $55,000 level. And, that signifies a sign of an extent in exhaustion in the recent price reversal moves. The 14-day SMA trading indicator is between a mid-point of $60,000 and $55,000 points over the 50-day SMA trend-line The Stochastic Oscillators are dipped into the oversold region attempting to close the hairs within it. That suggests that the recent declining pressure is getting to an end.
Will BTC be overwhelmed by the US Dollar in the next active marketing operations?
As at this point, it is highly expected of the BTC/USD bulls to get prepared with a more sustainable strength to spike up from the base support line of $55,000 in the near session. That trading point is very crucial as of now in the further determination of a change in the market’s definite direction. Meanwhile, a continued featuring of inactive moves will lead to a long witnessing of higher lows in the trading zone of the $55,000 level.
As regards the market further downsizing in valuation, bears need to consolidate their efforts by adding more to their energy to be able to breach past the support level of $55,000 in the next more active trading session. However, the support line at $50,000 will be very much more difficult for a downward move to break beyond afterward.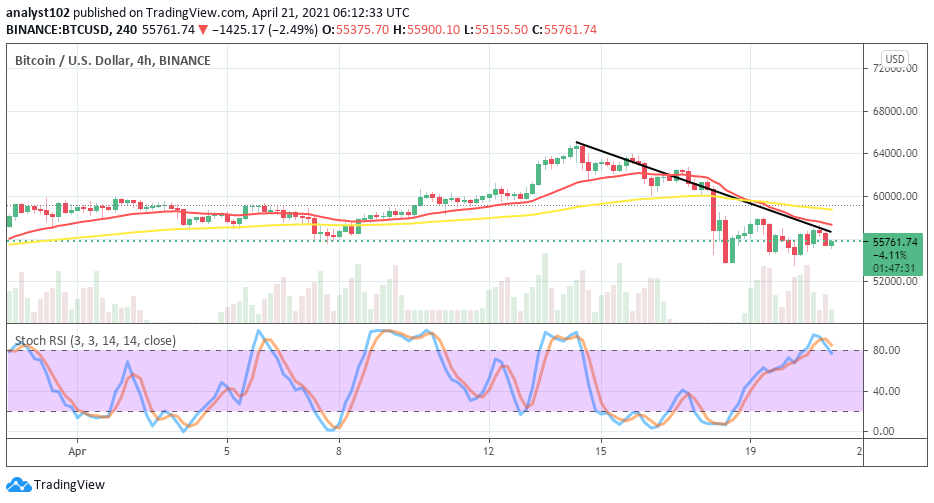
BTC/USD 4-hour Chart
The BTC/USD medium-term chart depicts that the market valuation of Bitcoin is still to some extent facing pressure inflicted on by the USD Dollar. SMA trading indicators are clearly showing it as price has been trading on the sides of their sell-signal. The 50-day SMA trend-line is intercepted by the 14-day SMA trend-line from the top. The Stochastic Oscillators are in the overbought region slightly pointing towards the south to indicate an extent of probably getting to see more downsides. But, a strong support level has surfaced to let have the maximum extent the present BTC/USD downward move may achieve in the subsequent bearish probability movement.
Note: cryptosignals.org is not a financial advisor. Do your research before investing your funds in any financial asset or presented product or event. We are not responsible for your investing results.