Bitcoin (BTC/USD) Trade Holds Upsurges
Estimated Reading Time: 3 minutes
Don’t invest unless you’re prepared to lose all the money you invest. This is a high-risk investment and you are unlikely to be protected if something goes wrong. Take 2 minutes to learn more
Bitcoin Price Prediction – August 11
The BTC/USD trade holds upsurges firmly in the trading levels of $45,000 and $50,000. The crypto economy now trades around the point of $46,809 at a rate of 1.24%.
BTC/USD Market
Key Levels:
Resistance levels: $47,500, $50,000, $52,500
Support levels: $42,500, $40,000, $37,500
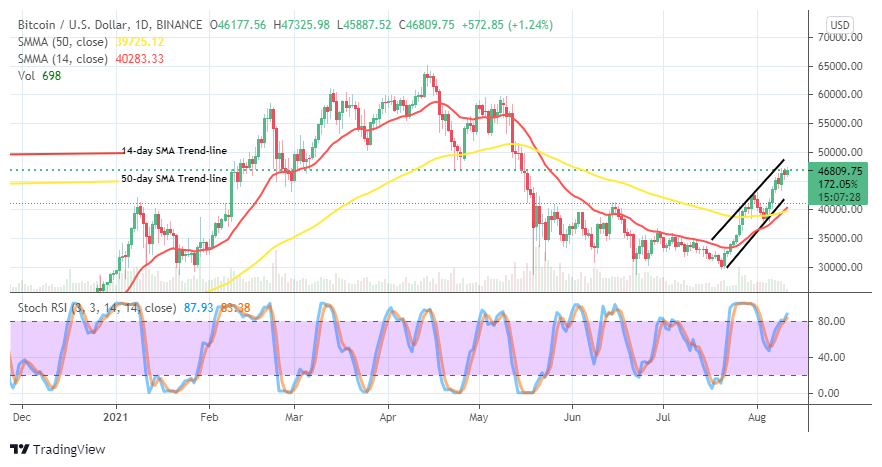
BTC/USD – Daily Chart
The BTC/USD trade holds upsurges indefinite trading lines at higher zones. The daily chart showcases successive bullish candlesticks in their length, approaching some other higher zones. The 50-day SMA trend-line is almost been intercepted by the 14-day SMA trend-line from underneath to the upside. The bullish channel trend lines are intact as the market keeps featuring within. The Stochastic Oscillators have crossed the lines slightly past the range 80 into the overbought region, pointing to the northbound to indicate that the market is still on course for gains.
The crypto trade holds upsurges; will it push more northward to a higher line around $47,500?
The BTC/USD market bulls are now having better as the trade holds upsurges at a higher trading zone. Since a slight breakup at $40,000 occurred around August 4, the price has been able to continually press northward further, aching appreciative better results at the expense of bears’ retarding weaknesses. A slight pull-down of the market in the points of $45,000 and $47,500 may not be enough to think that price will get reverse in the near time. However, if that assumed move heightens at the line earlier mentioned, bulls will have to suspend exertion of orders.
Regarding the return of a downward movement of this crypto trade, bears could wait for price action rejection around higher points at $47,500 or a bit near to it to probably fish out a decent sell entry. A bit clarity about that assumption, traders are advised to figure out a position from the perspectives of analyzing, using 4-hour and 1-hour charts to detect the real market direction at a given period.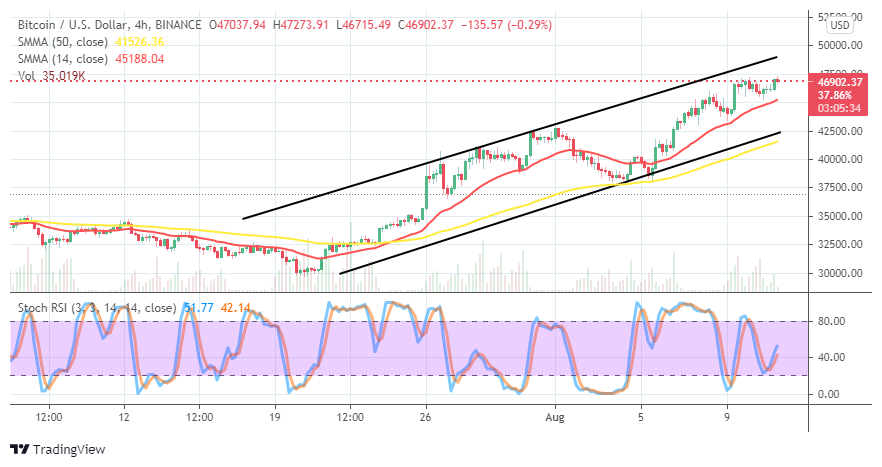
BTC/USD 4-hour Chart
The medium-term chart shows that the crypto trade holds upsurges within well-articulated bullish channel trend lines. It shows that the crypto economy is on the course of rejuvenating the energy to push northward further. The positioning outlook of the Stochastic Oscillators gives a conformational backup to that assumption as their lines point northbound a bit above range 40 from around the base range-line at 20. The 14-day SMA trend-line is over the 50-day SMA trend-line. And, they both point to the north below the trading value of the market. Price may soon encounter resistance around a higher level at $47,500. s, Pushing Northward
Note: Cryptosignals.org is not a financial advisor. Do your research before investing your funds in any financial asset or presented product or event. We are not responsible for your investing results.
You can purchase crypto coins here. Buy Tokens