Bitcoin (BTC/USD) Valuation Retraces Heavily
Estimated Reading Time: 3 minutes
Don’t invest unless you’re prepared to lose all the money you invest. This is a high-risk investment and you are unlikely to be protected if something goes wrong. Take 2 minutes to learn more
Bitcoin Price Prediction – September 22
It indicated that the BTC/USD valuation retraces heavily to touch one of the past critical support lines at $40,000. The crypto-economic price trades around the line of $42,700 at about the percentage rate of 2.42 as of writing. It shows that a degree of ups is being made in the market presently.
BTC/USD Market
Key Levels:
Resistance levels: $45,000, $47,500, $50,000
Support levels: $40,000, $37,500, $35,000
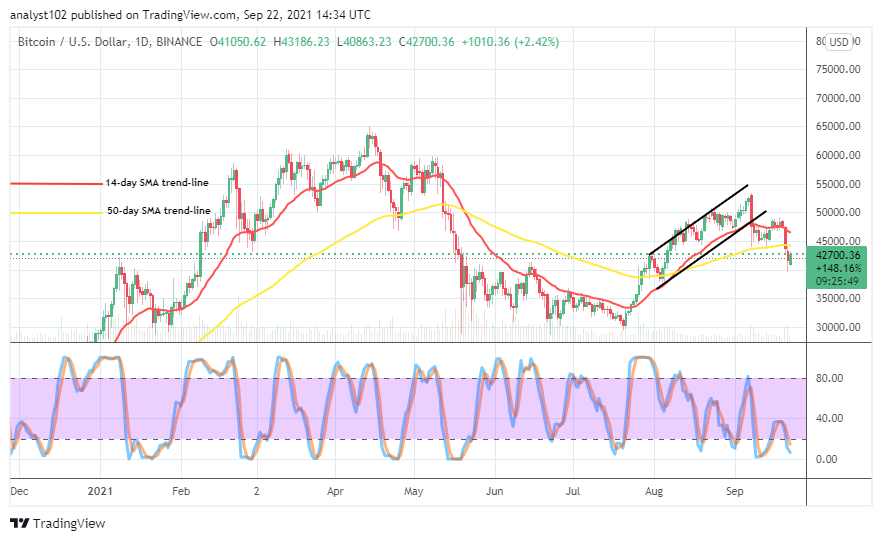
BTC/USD – Daily Chart
The BTC/USD daily chart presently reveals that the crypto-fiat currency pair valuation retraces heavily, touching the support line of $40,000 during yesterday’s operations. The successive breaking down of the bigger SMA trend line on the September 20th session has led to trading candlesticks beneath the indicators. The 14-day SMA indicator is above the 50-day SMA indicator with a slight southward-bent posture at the top. The Stochastic Oscillators have turned southbound from range 40 dipped into the oversold region, trying to close the lines. And, that could be a tart to see a possible returning of an upward motion in no time.
As the BTC/USD valuation retraces heavily, could there be more drop-offs beyond $40,000?
As the BTC/USD valuation retraces heavily, touching the $40,000 level yesterday, there can be further drop-offs in the crypto-economic operations, especially if the price encounters strong resistance around $45,000 buyers appear to have found support at the touching of that value line. But, it has not far from the possibility of getting invalidated while price tends reverting to further southward fearful forces against the point. Be as it may, buying pressure appears to continually look for a strong support baseline to re-launch its presence in the market soon afterward.
On the downside, the current price upspring motion appears to be in a rallying mode may hit a resistance a bit over the $45,000 where the smaller SMA is. If that assumption eventually plays right, sellers may find a good stance to re-launch. At the heightening of a downward motion, the market will potentially push for lower value beneath the line of $40,000 in the long run.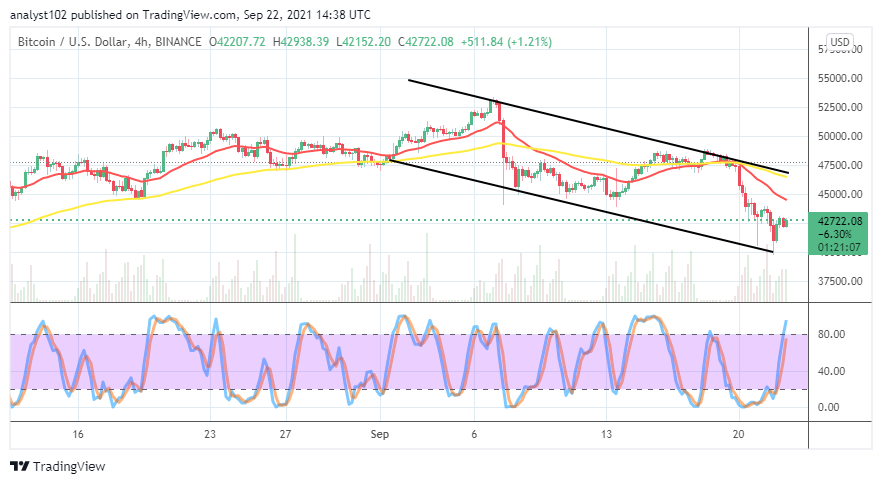
BTC/USD 4-hour Chart
The BTC/USD medium-term chart shows that the crypto-economic valuation retraces heavily, running more into been a bearish trend outlook. The 50-day SMA indicator is over the 14-day SMA indicator as the bearish trend line drew over them southward, joining the bigger SMA trend line at the tail end. The bearish channel trend lines drew to determine the crucial high and low points that the market has been pushing. The Stochastic Oscillators have traveled northbound from the oversold region, briefly penetrating the overbought zone. Technically, on the 4-hour chart, the $45,000 will be the actual resistance trading zone that price may lose momentum again, in a continuation of the downward trend. Like wisely, the $40,000 tends to be the real support axis that the market may not breach past for sustainability.
Note: Cryptosignals.org is not a financial advisor. Do your research before investing your funds in any financial asset or presented product or event. We are not responsible for your investing results.
You can purchase crypto coins here. Buy Tokens