Lucky Block Price Prediction: LBLOCK/USD Will Face the North
Estimated Reading Time: 3 minutes
Don’t invest unless you’re prepared to lose all the money you invest. This is a high-risk investment and you are unlikely to be protected if something goes wrong. Take 2 minutes to learn more
Lucky Block Price Prediction – January 6
The Lucky Block price prediction trades around $0.000051 as the buying pressure could push the market above the moving averages.
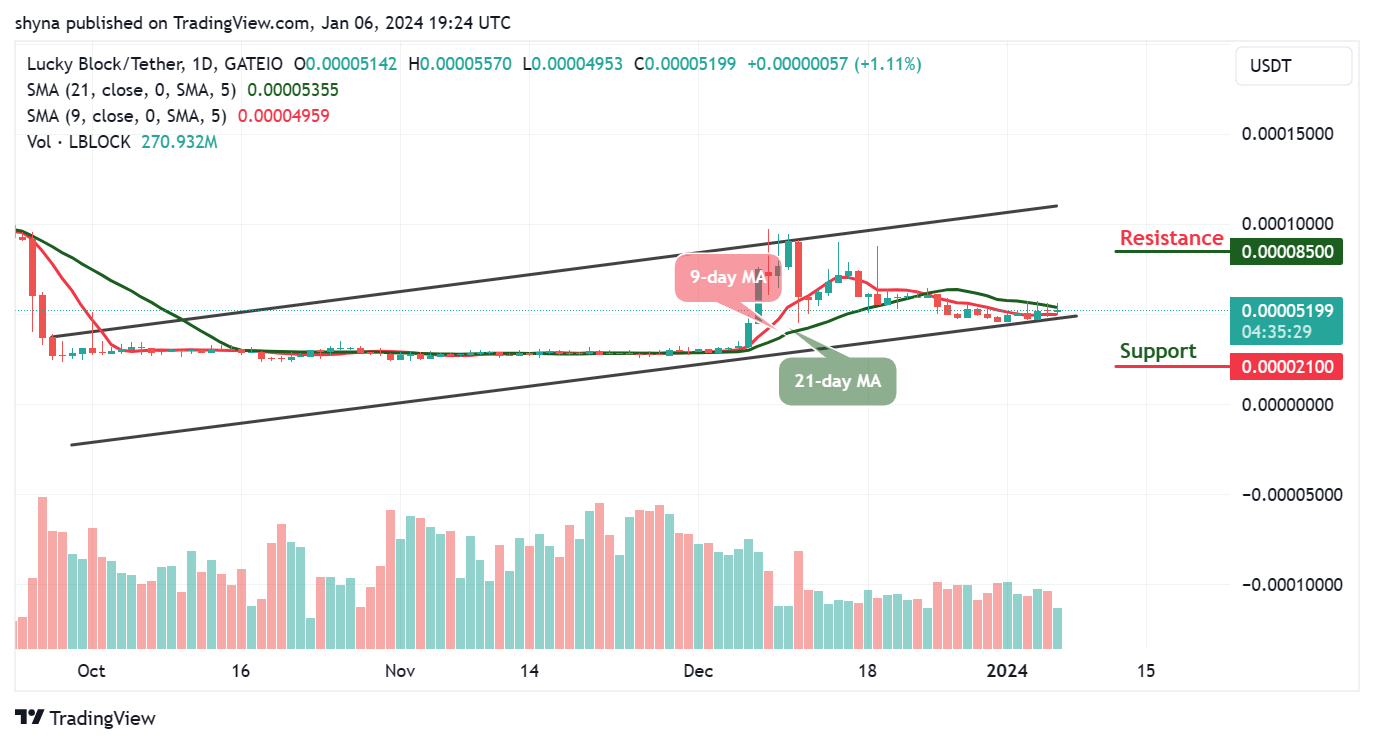
LBLOCK/USD Long-term Trend: Ranging (1D Chart)
Key Levels:
Resistance levels: $0.000085, $0.000087, $0.000089
Support levels: $0.000021, $0.000019, $0.000017
LBLOCK/USD is poised to ascend toward the upper boundary of the channel as the coin prepares to surpass the 9-day and 21-day moving averages. Notably, bullish momentum has successfully maintained the price above the $0.000051 threshold for an extended period. Concurrently, this cryptocurrency seems to have established robust support, suggesting potential upward momentum ahead.
Lucky Block Price Prediction: LBLOCK/USD Heads to the Upsides
The Lucky Block price is poised for a surge in trading volume, accompanied by a bullish rally in a positive direction. However, if the coin fails to initiate its upward momentum, it could face intensified bearish pressure, creating more opportunities for new investors to enter at lower levels. Key support levels to monitor are $0.000021, $0.000019, and $0.000017.
The price of Lucky Block is expected to turn bullish once the 9-day moving average crosses above the 21-day moving average. Concurrently, if the bulls drive the price upward, potential resistance levels at $0.000085, $0.000087, and $0.000089 will come into focus.
LBLOCK/USD Medium-term Trend: Ranging (4H Chart)
Examining the 4-hour chart, the Lucky Block price remains positioned above the 9-day and 21-day moving averages, signaling a potential upward trajectory for the coin. If the price surpasses the upper boundary of the channel, Lucky Block could embark on an upward trend, potentially reaching the resistance level at $0.000060 and above.
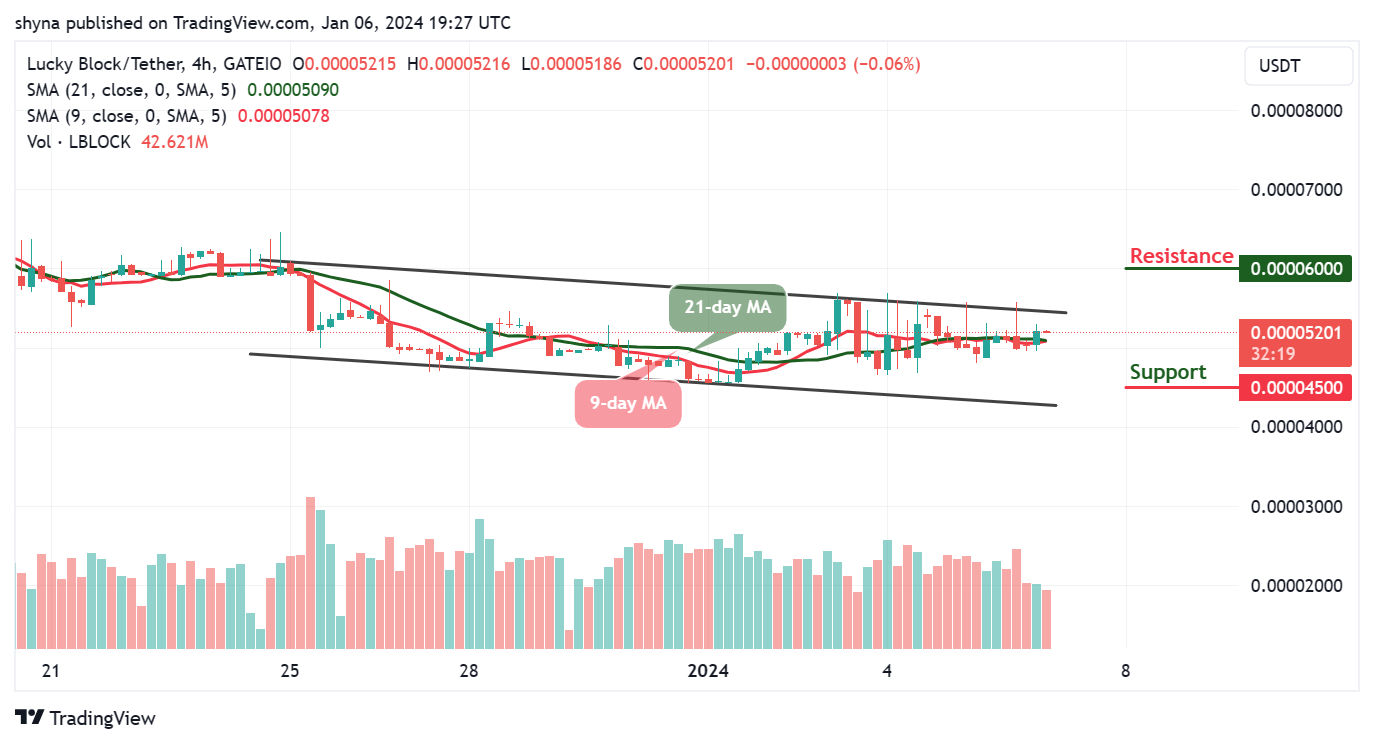
Conversely, the Lucky Block price can dip below the moving averages, targeting the support level around $0.000045 and below. In such a scenario, buyers are anticipated to capitalize on these dips. Additionally, a crossover is expected where the 9-day moving average could surpass the 21-day moving average, indicating a bullish momentum soon.
You can purchase Lucky Block here. Buy LBLOCK