Litecoin (LTC/USD) Price Dumps Deeper to $80
Estimated Reading Time: 3 minutes
Don’t invest unless you’re prepared to lose all the money you invest. This is a high-risk investment and you are unlikely to be protected if something goes wrong. Take 2 minutes to learn more

Free Crypto Signals Channel
Litecoin Price Prediction – May 10
LTC/USD market isn’t spared among the most well-known crypto economies that are currently trying to recover from the depth of downing trade sessions over a couple of several sessions. The truth of the trading situation states the crypto-economic price dumps deeper to around $80 and, is now trading around the $81 line, keeping an average percentage rate of 7.33 positives.
LTC/USD Market
Key Levels:
Resistance levels: $100, $110, $120
Support levels: $70, $60, $50
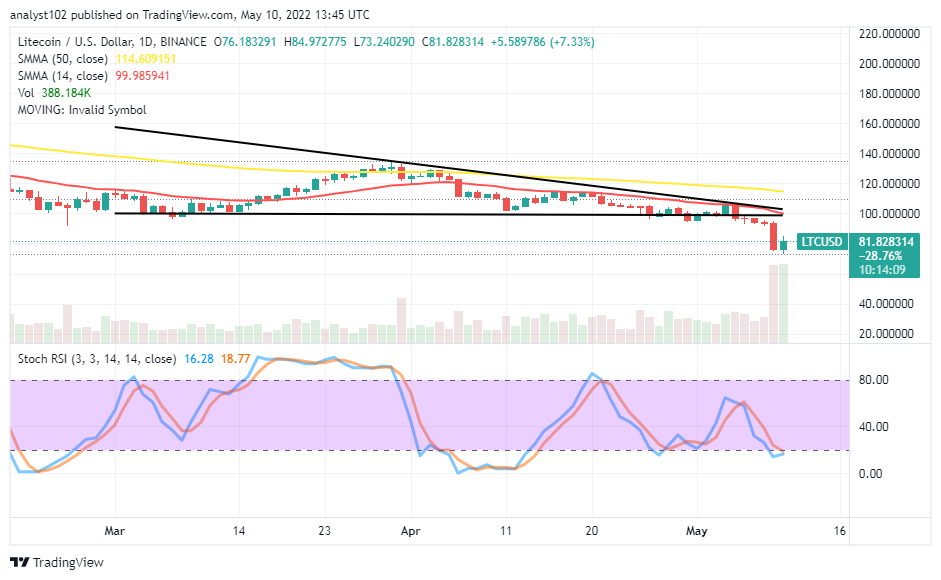
LTC/USD – Daily Chart
The LTC/USD daily chart showcases the crypto-economic market price dumps deeper to $80, following the inability of upward momentum to hold back against the depressive-trading moment that occurred on May 5. The 14-day SMA is underneath the 50-day SMA and, the horizontal line drawn at $100 to showcase the crypto economy is currently trading under a critical bearish condition. The Stochastic Oscillators are around the range of 20, seemingly attempting to close their lines to signal a change of direction.
Will there be more falls beyond the $70 support level in the LTC/USD price?
Though the impact of the recent downing forces is yet to be over as it is observed that the LTC/USD market price dumps deeper to $80, today’s ongoing session has revealed a near possibility of getting an end to the declination process. In addition to that sentiment, price stands the potency of making a series of false dipping toward the $70 support to get a better stance to regain a suitable upswing to allow long-position takers to launch a buying order afterward.
On the downside of the technical analysis, the LTC/USD market short-position takers may now have to stay away from exerting a new selling position order around the $80 level. A long-holding of price around the $100 resistance level may in the long-term run bring about the risk of falling once again in the process. However, from that value line and the following lower points could term to be the best investment moment.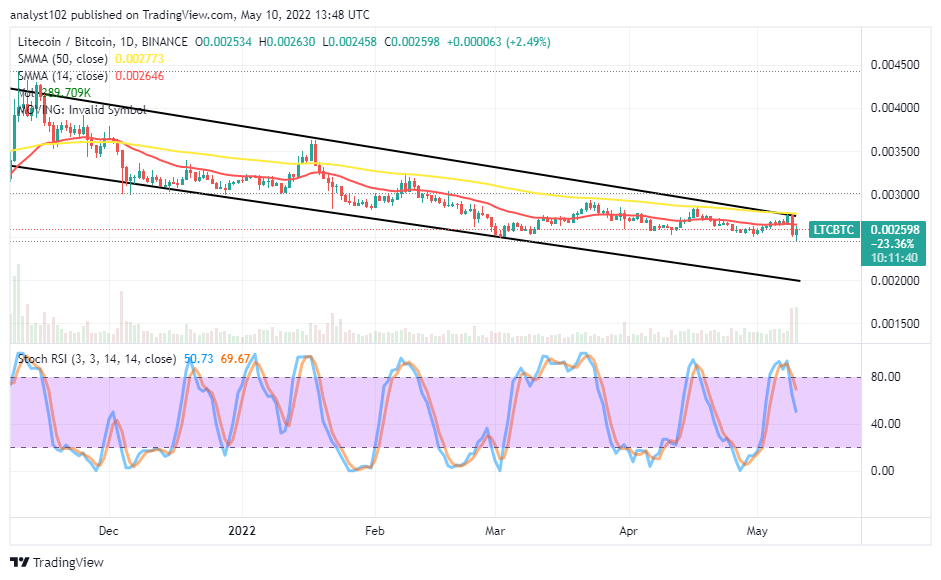
LTC/BTC Price Analysis
In comparison, Litecoin has lost momentum to push northward against the trending ability of Bitcoin. Just yesterday’s operations, a bearish candlestick occurred around the trend line of the bigger SMA to signify a come-back of the downing motion. The 14-day SMA indicator is beneath the 50-day SMA indicator. The bearish channel trend lines are drawn to enclose the trading SMAs within. The Stochastic Oscillators have southbound from the overbought region to point to the south side closely above the range of 40. There is a signal warning against getting to see the base crypto recover quickly as paired with the most valuable global crypto.
Note: Cryptosignals.org is not a financial advisor. Do your research before investing your funds in any financial asset or presented product or event. We are not responsible for your investing results.
You can purchase Lucky Block here. Buy LBlock: