Bitcoin (BTC/USD) Valuation Trades Around the Vital Resistance Line of $60,000
Estimated Reading Time: 3 minutes
Don’t invest unless you’re prepared to lose all the money you invest. This is a high-risk investment and you are unlikely to be protected if something goes wrong. Take 2 minutes to learn more
Bitcoin Price Prediction – April 5
It has been over time that the BTC/USD market trades northbound to hit a resistance around the level of $60,000. The upward swing of price is currently losing out energy as it hovers around the resistance trading zone.
BTC/USD Market
Key Levels:
Resistance levels: $65,000, $70,000, $75,000,
Support levels: $50,000, $45,000, $40,000
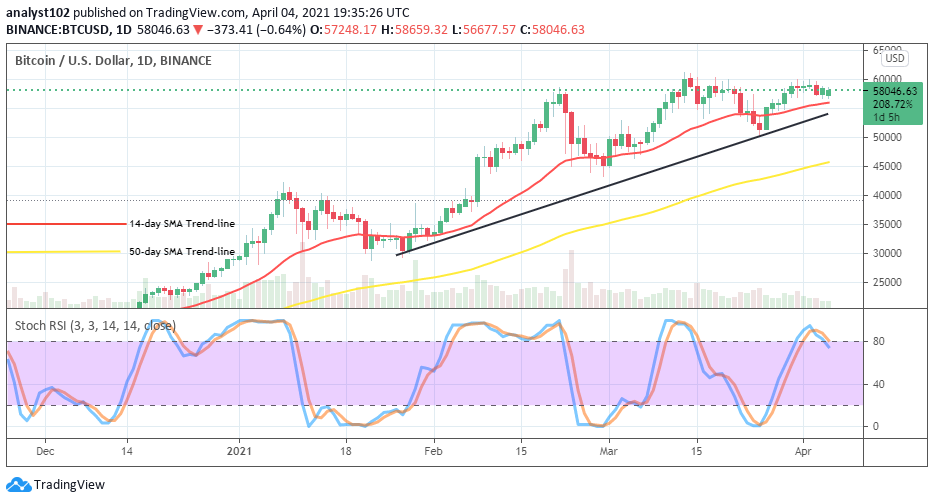
BTC/USD – Daily Chart
The bullish-trend outlook is still maintained on the BTC/USD daily trading chart despite the emergences of a line drops recently in the market. About a couple of trading days, the BTC/USD market operations have hovering closely around the main resistance of $60,000.
Will BTC/USD price enter a consolidation moving mode soon?
It has been closely noticed that as of writing, the capacity of bulls to push further northward appears not been strong enough as price has engaged featuring around the vital resistance value of $60,000. Taking that level into a serious consideration, the BTC/USD bulls have to strengthen their efforts against the line in order to be able to achieve a sustainable higher point above it.
A regards the downside of the crypto-market, the bears will to put up with patience to spot a line of visible price weaknesses during a move to the north to have a clear-cut sell sign. On the contrary, a slow move coupled with inactive reverses could bring about a series of short ups which may leave traders in an indecision trading situation for awhile. Meanwhile, support level of $55,000 as been taken as the critical that its southward breaching will signify the possibility of the market witnessing a change against the current bullish trend. 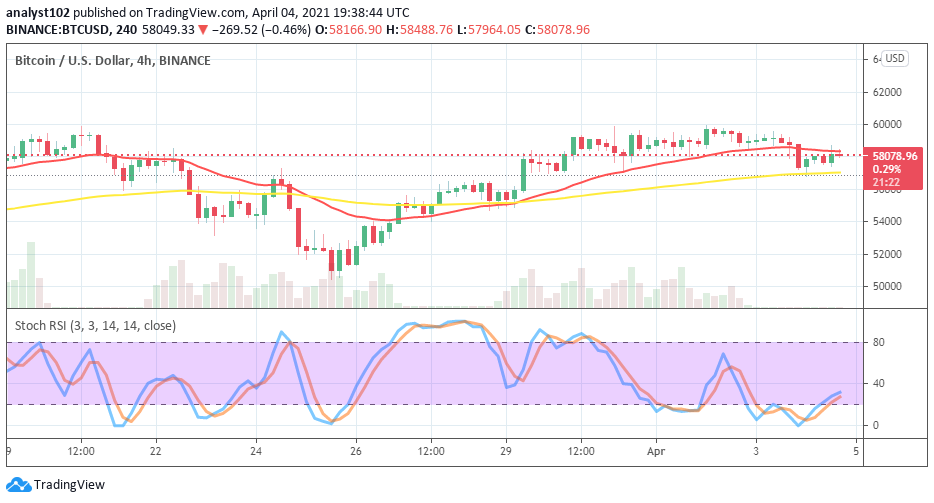
BTC/USD 4-hour Chart
There seems to be a price reversal in the BTC/USD market operations after a long serial pushes of BTC/USD to the north direction. Various candlesticks have emerged from the all-time high of $60,000 level downwards to a low point of $56,000 support level. The 50-day SMA is underneath the 14-day SMA They both point to the east to denote the possibility of getting to witness an equally pushing between the two market-movers. Meanwhile, either a breakout of the $60,000 level or a breakdown of the $56,000 level will
Note: cryptosignals.org is not a financial advisor. Do your research before investing your funds in any financial asset or presented product or event. We are not responsible for your investing results