Bitcoin Cash (BCH/USD) Price Continues to Trade Sideways
Estimated Reading Time: 3 minutes
Don’t invest unless you’re prepared to lose all the money you invest. This is a high-risk investment and you are unlikely to be protected if something goes wrong. Take 2 minutes to learn more

Free Crypto Signals Channel
Bitcoin Cash Price Prediction – July 8
The valuation of Bitcoin Cash’s price continues to trade sideways between trading lines of $125 and $100. In today’s session, the price has touched a high and low of $113 and $109, showing how the level of price actions has been less-active as it keeps a negative of 1.72%.
BCH/USD Market
Key Levels:
Resistance levels: $125, $150, $175
Support levels: $100, $80, $60
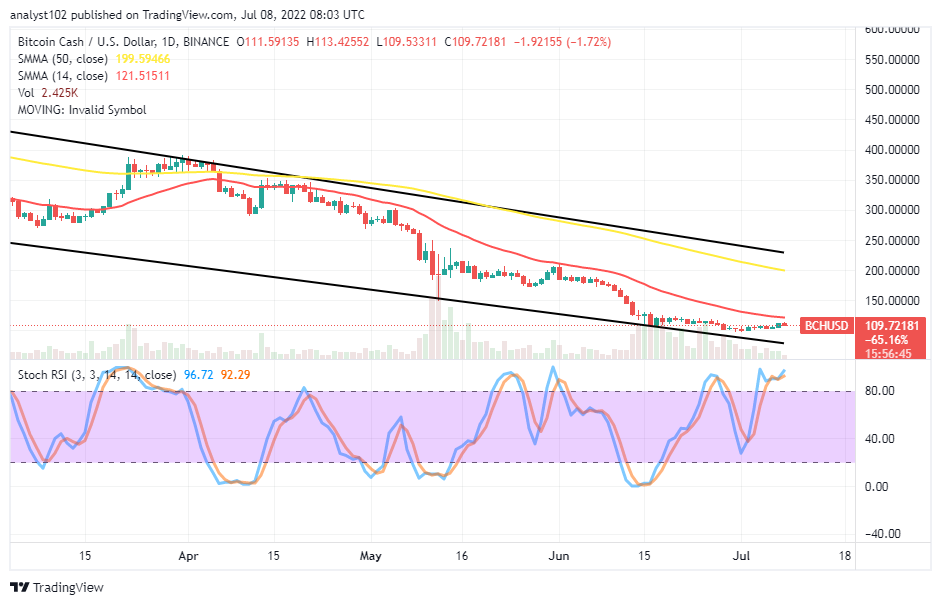
BCH/USD – Daily Chart
The BCH/USD daily chart showcases the crypto-economic price continues to trade sideways, closely below the sell signal side of the smaller SMA. The 14-day SMA indicator is underneath the 50-day SMA indicator. The bearish trend lines are to embody the SMAs. The Stochastic Oscillators are in the overbought region, seemingly trying to consolidate within. A smaller candlestick is in the making to signify the market is experiencing depression in a lighter mode.
Will the BCH/USD market change direction soon, trading sideways?
There has been no reliable signal to suggest the BCH/USD market will change direction soon as the crypto-economic price continues to trade sideways underneath the trend line of the 14-day SMA. It would be technically ideal for long-position takers to wait for the price to reverse to a lower-trading zone toward or around the lower bearish trend line drawn before attempting to re-launch a buying order.
On the downside of the technical analysis, the trading SMA indicators indicated that the primary resistance to the current trading situation is around the points of $199 and $121. The reading combination of the Stochastic Oscillators and a smaller bearish candlestick in the making suggested the BCH/USD market sellers possess an upper hand against the price’s possibility of surging past the 14-day SMA trend line in the near time.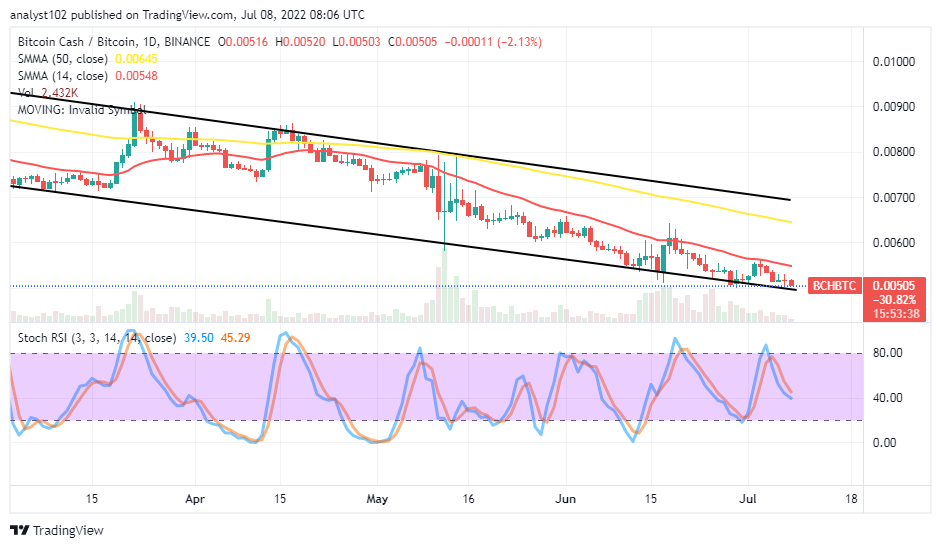
BCH/BTC Price Analysis
Bitcoin Cash has been under a declining-moving mode pairing with the trending capacity of Bitcoin. The cryptocurrency pair price continues to trade by maintaining a downward-trending motion to the spot of the lower bearish trend line. The Stochastic Oscillators have moved southbound to touch the range of 40. The situation suggests the base crypto may soon be striving to swing upward back against its counter-trading crypto. Traders can check out for the emergence of a bullish candlestick at a lower-trading support level, using a lower time of either 1-hour or 4-hour chart for confirmation before exerting buying positions afterward.
Note: Cryptosignals.org is not a financial advisor. Do your research before investing your funds in any financial asset or presented product or event. We are not responsible for your investing results.
“Lucky is up more than 50% today but still more than 430% from All Time Highs!
The opportunity to bank BIG is now!
You can purchase Lucky Block here. Buy LBlock