Chainlink (LINK/USD) Demonstrates a Bullish Breakout
Estimated Reading Time: 3 minutes
Don’t invest unless you’re prepared to lose all the money you invest. This is a high-risk investment and you are unlikely to be protected if something goes wrong. Take 2 minutes to learn more
The bear market of August brought the market to the $6.00 price level, and Chainlink has continued to struggle at this level since the second half of August up until today’s market. However, notable changes have transpired since September. As early as the first day of this month, the market has exhibited rapid price oscillations, albeit within a confined price range.
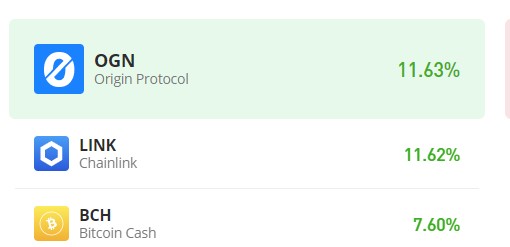
This development could be viewed as a potential signal for both traders and analysts, indicating the market’s readiness for a substantial movement—a scenario that is currently unfolding. As of the present trading session, the market has sustained a noteworthy gain of 11.15%. The bullish sentiment is notably robust.
Chainlink Market Data
- LINK/USD Price Now: $6.7548
- LINK/USD Market Cap: $3,761,933,460
- LINK/USD Circulating Supply: 556,849,970 LINK
- LINK/USD Total Supply: 1,000,000,000 LINK
- LINK/USD CoinMarketCap Ranking: #19
Key Levels
- Resistance: $7.00, $7.50, and $8.00.
- Support: $6.00, $5.50, and $5.00.
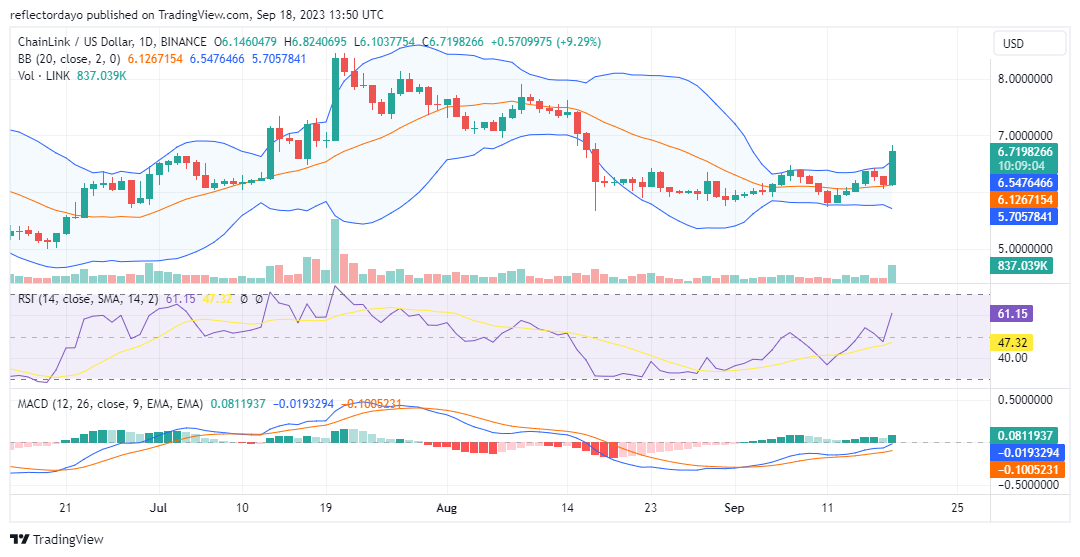
Price Prediction for Chainlink: The Indicators’ Point of View
The indicators unequivocally signal a robust bullish market. The Relative Strength Index (RSI) depicts the Chainlink price surging almost vertically, propelling the market from equilibrium into considerably bullish territory. Presently, the momentum registers at 61.27. In the Moving Average Convergence and Divergence (MACD), the MACD line is on the verge of crossing above the zero level.
However, it is essential to consider the readings of the Bollinger Bands and the Volume of Trade indicator. In terms of the Bollinger Bands indicator, although the price executed a notable breakout with a strong bullish candle, the Bands’ divergence lags behind this rapid market development. The upper bands have not responded adequately to the strong bullish market. Additionally, the Volume of Trade indicator boasts an impressive histogram that corroborates the market’s movement, yet its magnitude may not be deemed entirely sufficient to substantiate this market progression. While these indicators may seem somewhat lagging, their subtle signals provide ample support for the prevailing bullish sentiment.
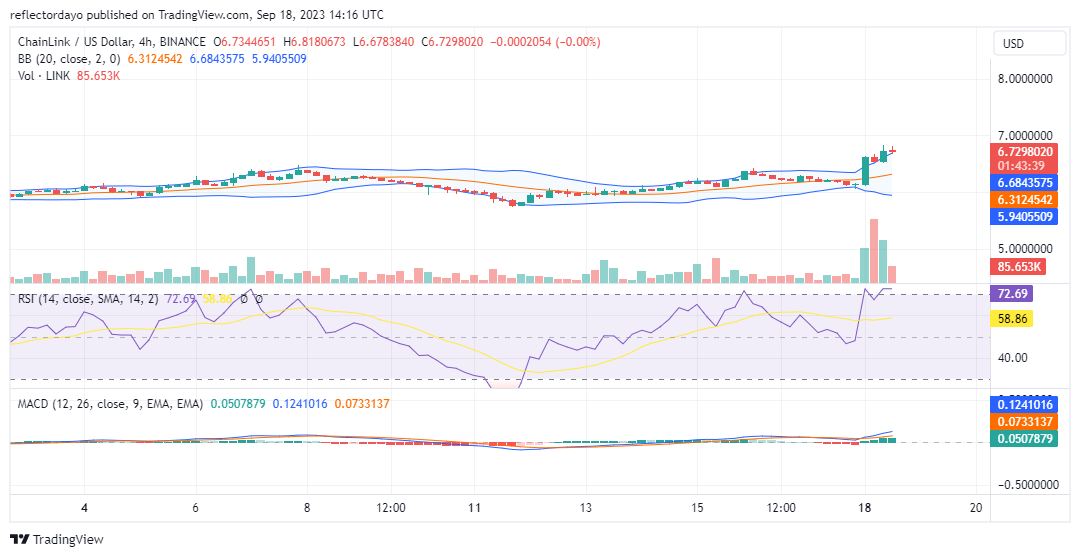
LINK/USD 4-Hour Chart Outlook
Examining the market from a 4-hour chart perspective, we observe a deceleration in market momentum. According to the Relative Strength Index (RSI), the market has ventured into overbought territory. This juncture typically invites profit-taking and the potential for a general price correction. Following the identification of a robust higher support level, the market is anticipated to experience a rebound, sustaining its upward trajectory. The $7.00 price point could serve as the next significant milestone for the market.