Ethereum (ETH/USD) Price Declines Significantly, Making a Rebound
Estimated Reading Time: 3 minutes
Don’t invest unless you’re prepared to lose all the money you invest. This is a high-risk investment and you are unlikely to be protected if something goes wrong. Take 2 minutes to learn more
Ethereum Price Prediction – December 6
The ETH/USD market operation is not secluded from the crypto-financial list book of records that witnesses a reduction in its valuation as the crypto-economic price declines significantly, making a rebound after hitting strong support at a depth trading zone. Currently, the rate at which the market pushes is at about 3.34 percent to trade around $4,061.
ETH/USD Market
Key Levels:
Resistance levels: $4,250, $4,500, $4,750
Support levels: $3,750, $3,500, $3,250
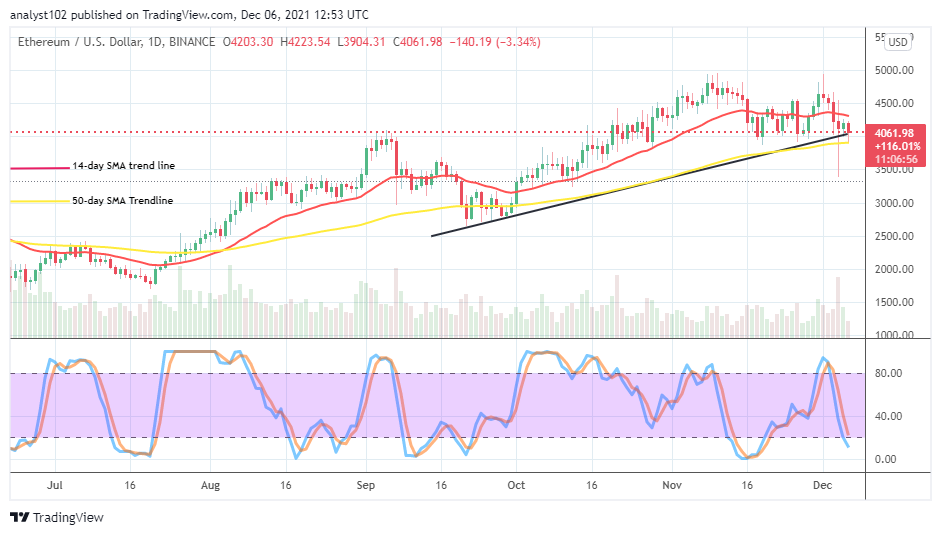
ETH/USD – Daily Chart
The ETH/USD daily chart reveals that the crypto-economic price declines significantly, making a rebound on a quick note during December 4th trading day. The market had pushed down lower to around $3,400 in the process before starting to witness a rebounding motion. The 50-day SMA indicator is underneath the 14-day SMA indicator with a space between them. The Stochastic Oscillators are dipped into the oversold region briefly. That suggests the market may be heading toward an end, denoting a return of downward pressures’ weaknesses situation.
Will the ETH/USD market push back northwardly above the $4,000 current psychological level as the crypto-economic price declines significantly, making a rebound?
There have been several variants attempts been made by the ETH/USD market bulls as the crypto-economic price declines, making a rebound. Presently, it appears that the market is trying to rebuild stances around the $4,000 level, leaving out the $3,500 support level since the last couple of days when the decline surfaced. Long-position takers may have to get repositioned while a downward move gets reversed beneath the higher point mentioned earlier before considering a buy order.
On the downside, the ETH/USD market short-position takers needed to consolidate their grand between $4,000 and the higher resistance level of $4,250 to retard any efforts that the current rebounding intrigues can degenerate into a full-fledged upside moving outlook in the long run. However, the down-turning of the market appears not to hold the values sustainably beyond the support level at $3,500.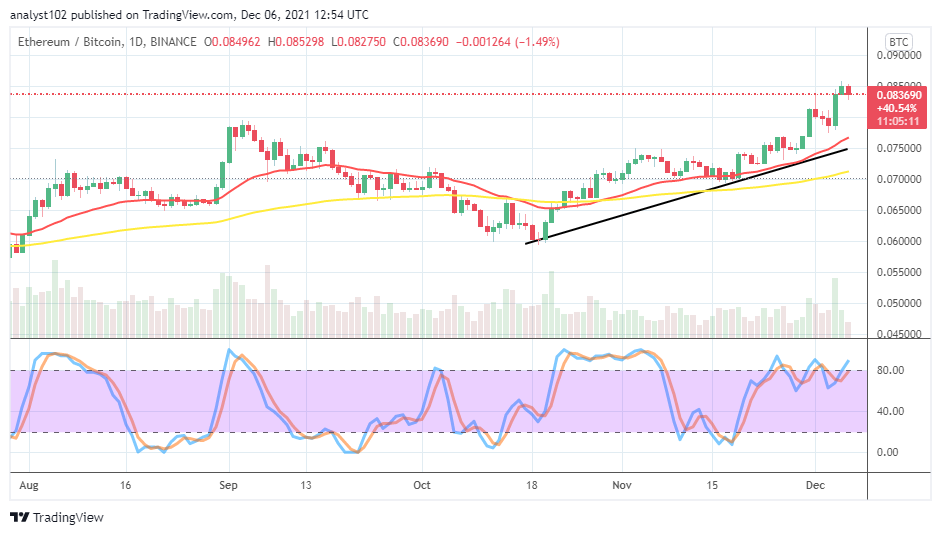
ETH/BTC Price Analysis
In comparison, Ethereum as the base crypto continues to dominate the market at the expense of Bitcoin as the flagship counter trading tool. The cryptocurrency pair has continued to surge higher to the north over several sessions. The 14-day SMA trend line is above the 50-day SMA trend line. The Stochastic Oscillators have continued to move in a consolidation manner around range 80, involving overbought region in the process currently. Being as it is, there has been no significant sign portending, seeing the base crypto coming down in trending capability for its counter crypto in the near time.
Note: Cryptosignals.org is not a financial advisor. Do your research before investing your funds in any financial asset or presented product or event. We are not responsible for your investing results.
You can purchase crypto coins here. Buy Tokens