Polkadot Recovers Above $4.90 Low as Short Sellers Threaten
Estimated Reading Time: 2 minutes
Don’t invest unless you’re prepared to lose all the money you invest. This is a high-risk investment and you are unlikely to be protected if something goes wrong. Take 2 minutes to learn more

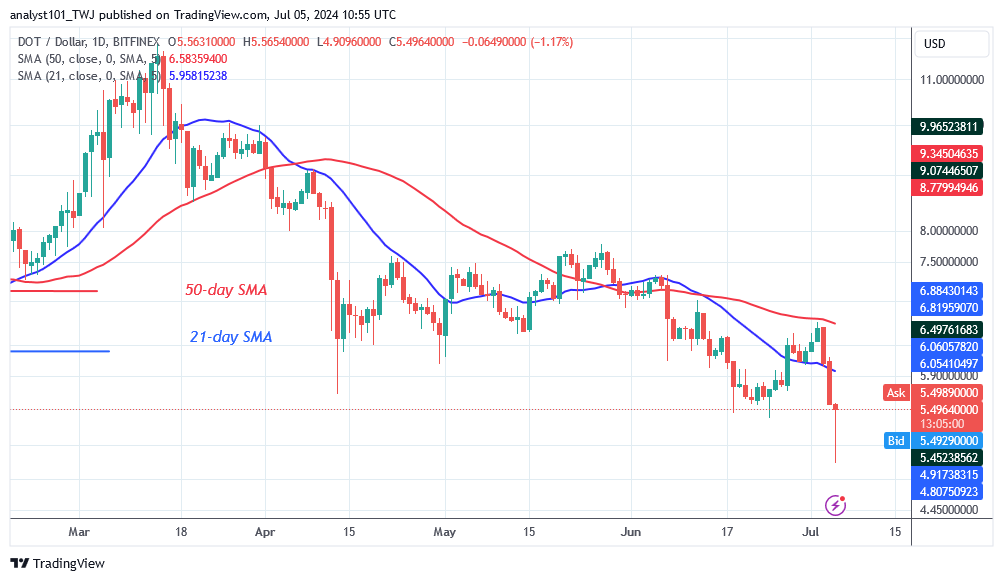
Polkadot (DOT) Long-Term Analysis: Bearish
Polkadot’s (DOT) price has fallen to the low of $4.90 as short sellers threaten. Since June 27, the DOT price has been caught between the moving average lines. The cryptocurrency traded above the 21-day SMA support but below the 50-day SMA resistance. On July 2, the bulls reached a resistance level and fell significantly.
The negative momentum surpassed the $6.20, 21-day SMA, and the $5.45 support levels, reaching a low of $4.90. The bulls then bought the dips and held the drop above the $5.52 support. According to the price prediction, the altcoin will decline to a low of $4.05.
Technical indicators
Major Resistance Levels – $10, $12, $14
Major Support Levels – $8, $6, $4
Polkadot (DOT) Indicator Analysis
On July 5, a long candlestick tail points to the present support level of $4.90. The extended candlestick tail implies significant buying pressure at the current support level. The moving average lines slope downward, and a bearish crossover confirms the bearish indicator.
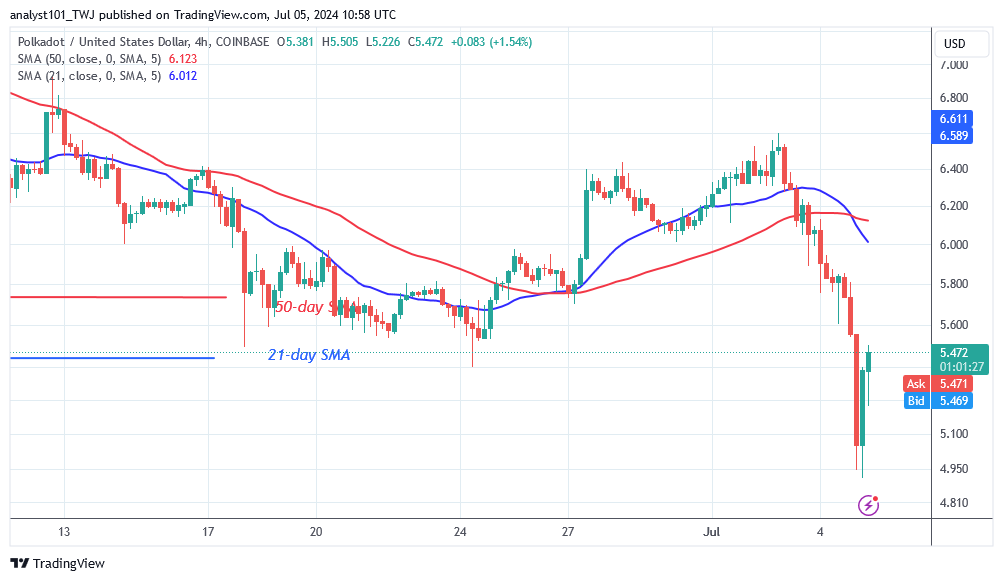
What Is the Next Direction for Polkadot (DOT)?
On the 4-hour chart, Polkadot has declined sharply to the low of $4.94 as short sellers threaten . Before the recent breakdown, Polkadot traded between $5.50 and $6.40. The bulls bought the dips but the upward correction may face rejection at the $5.50 resistance zone. The crypto signal is still negative as the altcoin faces rejection at the recent high.
You can purchase Lucky Block here. Buy LBLOCK
Note: Cryptosignals.org is not a financial advisor. Research before investing your funds in any financial asset or presented product or event. We are not responsible for your investing results.