Bitcoin Price Prediction: BTC Dips Below a Two-Month-Old Support Level
Estimated Reading Time: 3 minutes
Don’t invest unless you’re prepared to lose all the money you invest. This is a high-risk investment and you are unlikely to be protected if something goes wrong. Take 2 minutes to learn more

Bitcoin (BTC) Price Prediction: May 1
On the daily chart, BTC is showing bearish signs, indicating prices may fall even lower as it falls below a two-month-old support level. However, this may offer more traders the opportunity to enter the market.
BTC/USDT Long-term Trend: Bearish (Daily Chart)
Key Levels:
Resistance Levels: $65,000, $70,000, and $75,000
Support Levels: $55,000, $50,000, and $45,000
BTCUSDT – Daily Chart
Bitcoin Price Prediction: BTC/USDT Trades Below the $60,000 Threshold
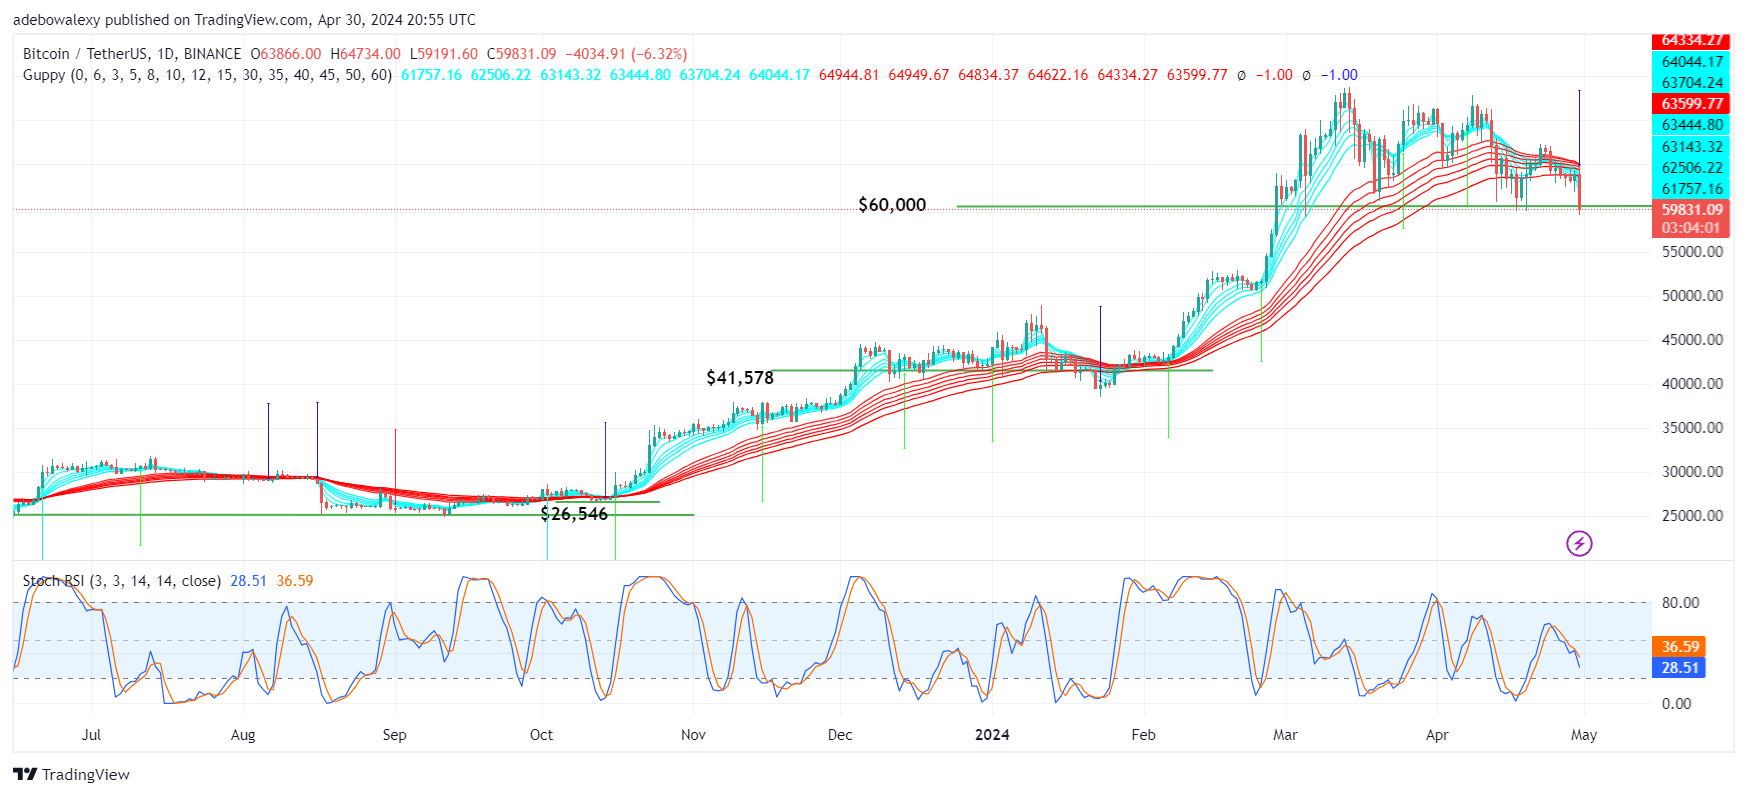
BTCUSD: Daily Chart
On the daily Bitcoin price chart, it can be seen that the King of Crypto took a sudden dip below the $60,000 support level. It is worth noting that this support level has been holding quite well for about two months. The spontaneous dip has placed the coin’s price action below the crossed Guppy Multiple Moving Average curves. Consequently, this signals that downward forces may gain more strength from this.
Bitcoin Price Prediction: Where is the BTC Market Heading?
At this point, BTC is trading just below the $60,000 mark. With the appearance of a lower shadow on the corresponding price candle for the ongoing session, one can deduce that traders have placed a re-entry below that price threshold. With traders re-entering the market, one can predict that the coin will revert above the $60,000 mark. Nevertheless, it is important to note that the crossed GMMA lines above the last price candle here may constitute a strong headwind to the market. However, it seems more likely that the price will recover above the $60,000 mark.
BTC/USDT Medium-term Trend: Reversal (4-H Chart)
While price action has fallen very quickly towards lower levels, it appears that this has triggered some buying. This could be seen through the last price candle on the chart. Meanwhile, the coin is still trading below the GMMA lines. Simultaneously, we can see that the Stochastic Relative Strength Index (SRSI) lines are now approaching a bullish crossover below the 20 mark of the indicator.
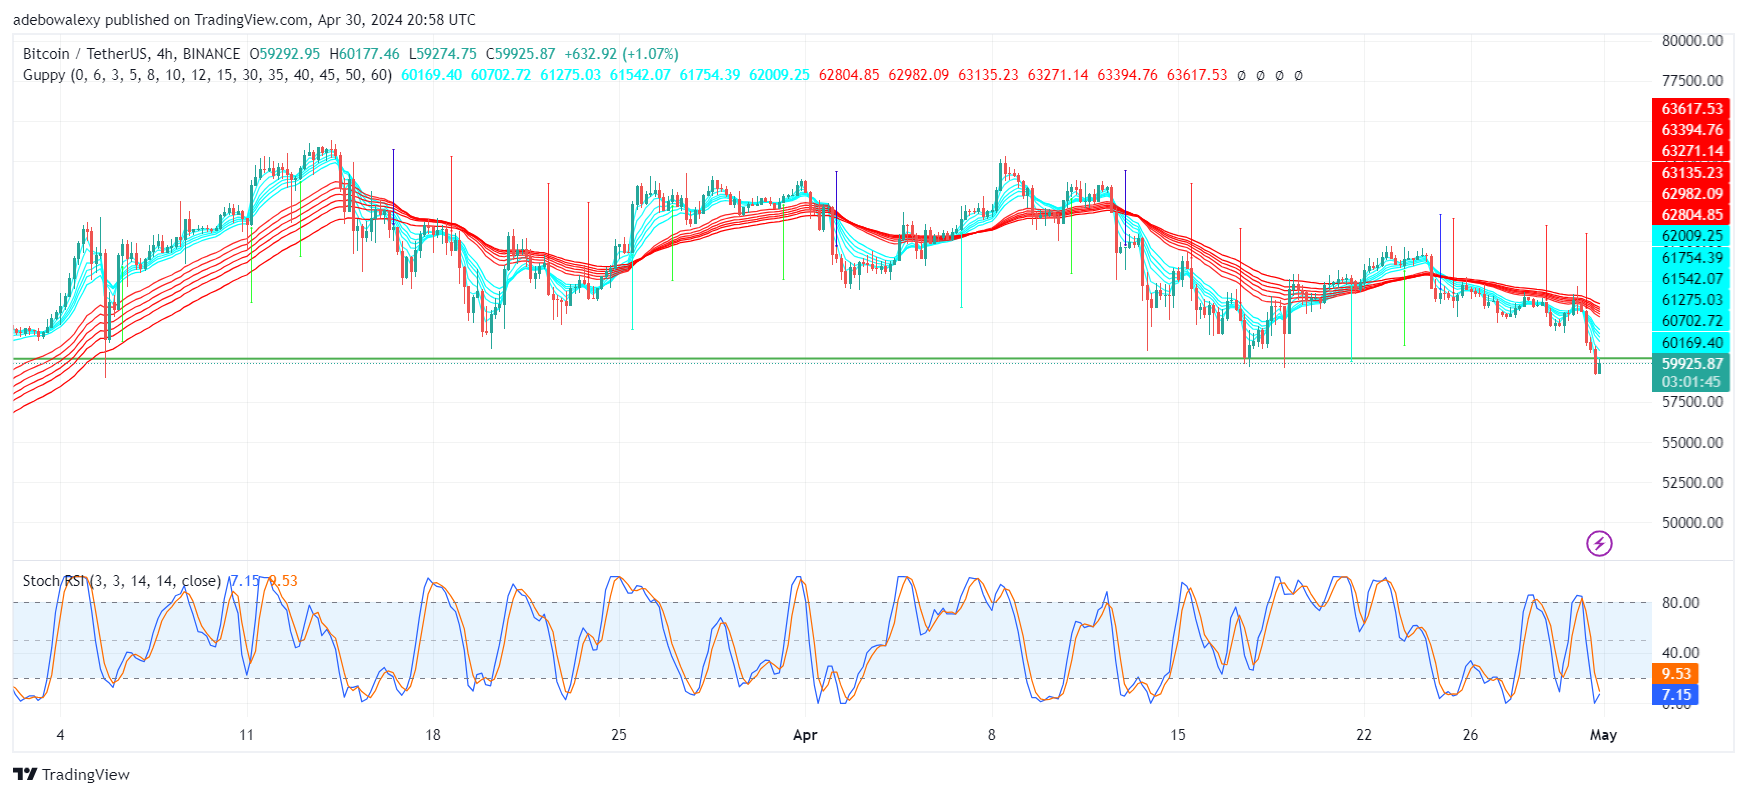
BTCUSDT – 4 Hour Chart
Contrary to the recovery opinion, a more downward correction may ensue should the $60,000 price level prove too strong to break for buyers. At this point, hopes of price action breaking the resistance constituted by the $60,000 price level seem quite viable. The brewing bullish crossover on the RSI indicator continues to hint that the upside momentum is increasing. Consequently, we may witness the market rise back above $60,000 to approach the $65,000 price level.
Get Bitcoin here. Buy BTC