Bitcoin (BTC/USD) Market Is Wallowing Upward, Pushing Slowly
Estimated Reading Time: 3 minutes
Don’t invest unless you’re prepared to lose all the money you invest. This is a high-risk investment and you are unlikely to be protected if something goes wrong. Take 2 minutes to learn more
Bitcoin Price Prediction – April 24
The kind of price actions that have been showcased in the BTC/USD market operations as of this analysis demonstrate that the price is wallowing upward and pushing slowly.
The market’s rebound to the upward has been firmly adhering to a trade zone where long-position movers must exert significant effort to secure additional recovery motions. If the price would still remain in the middle of the Bollinger Band, the current trading movement velocity suggests that the advances to the north may not be receiving the timely positive push needed to sustain them.
BTC/USD Market
Key Levels:
Resistance levels: $70,000, $72,500, $75,000
Support levels: $62,500, $60,000, $57,500
BTC/USD – Daily Chart
The BTC/USD daily chart shows that the market is wallowing upward and pushing slowly.
The lower Bollinger Band trend lines have held, providing a strong crypto signal that points to $60,000 as the next critical level at which the price should find support. The stochastic oscillators are being tentatively veering to the north while feigning a descent entry for bulls.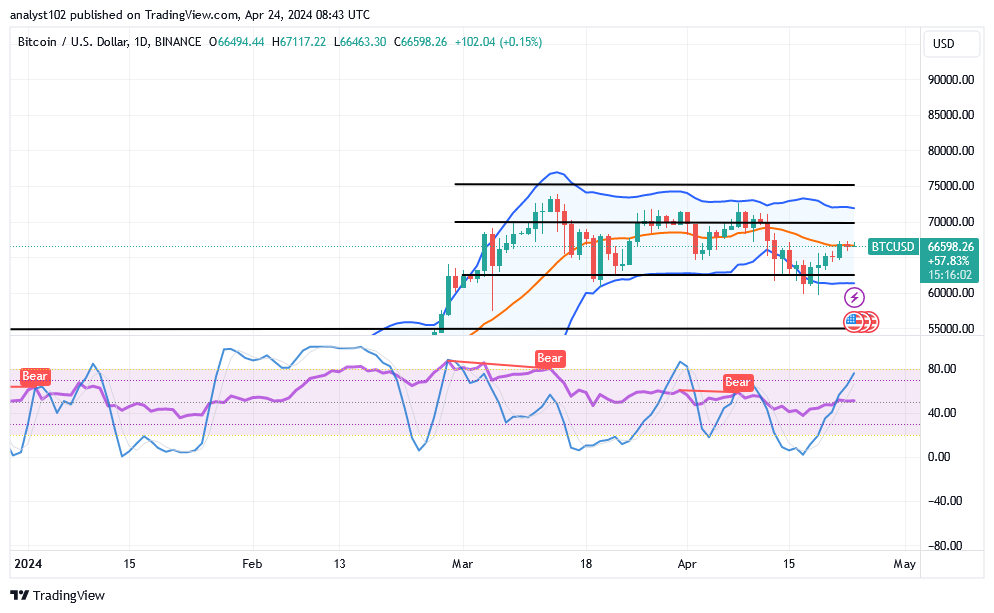
Will the current positive momentum speculation in the BTC/USD trade continue?
The positive pace of the crypto signal on the BTC/USD market operations may tend to prolong for a while, especially if the price doesn’t give back to a sudden fall-off, as the crypto economy is wallowing upward and pushing slowly.
The blue part of the stochastic oscillators has traversed northward to a notable higher spot nearing the line of 80 to denote that further pushes to the upside seem not to build on stable moves soon. Investors may still hold to the way back to $70,000 and even a bit above before tending to returning to a correction.
Bears may still need to be extra cautious in the area of the middle Bollinger Band. To open up some areas of entry for sellers, a series of rejections must occur below the $70,000 resistance line for a considerable amount of time.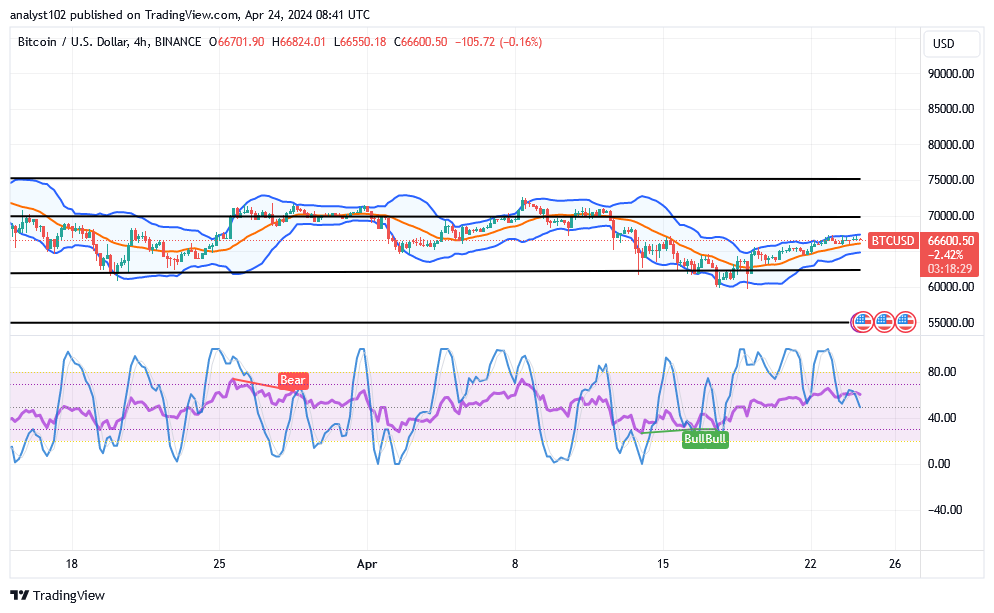
BTC/USD 4-hour Chart
The BTC/USD 4-hour chart showcases how the crypto-economic market is wallowing upward and pushing slowly.
The upward trend lines of the Bollinger Bands have continued to lead towards the $70,000 resistance line. At the 40-point, the stochastic oscillators are prone to repositioning and the potential for further building up. Points between the middle and he lower Bollinger Bands are liable to form the zones for the market to move to the north
Note: Cryptosignals.org is not a financial advisor. Do your research before investing your funds in any financial asset or presented product or event. We are not responsible for your investing results.
You can purchase Lucky Block here. Buy LBLOCK