Bitcoin Price Prediction: BTC/USD Bears May Slide Below $50,000 Support
Estimated Reading Time: 3 minutes
Don’t invest unless you’re prepared to lose all the money you invest. This is a high-risk investment and you are unlikely to be protected if something goes wrong. Take 2 minutes to learn more
The Bitcoin price prediction shows that BTC is likely to cross below the 21-day moving averages as the coin touches $50,679 support.
Bitcoin Price Prediction – February 23
BTC/USD Long-term Trend: Ranging (Daily Chart)
Key levels:
Resistance Levels: $58,000, $60,000 $62,000
Support Levels: $45,000, $43,000, $41,000
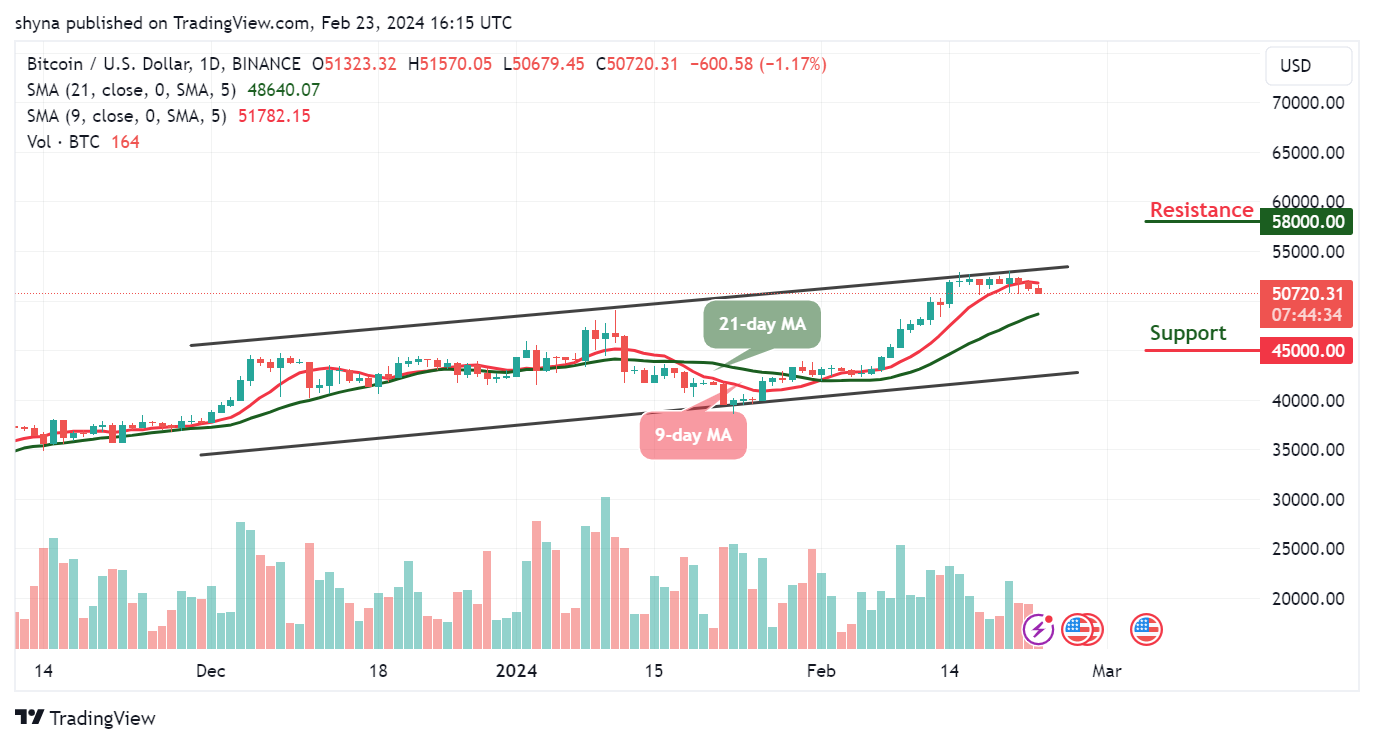
BTC/USD may face a setback that could drag the coin below the 21-day moving averages, and the king coin is likely to have an additional bearish run. Currently, Bitcoin (BTC) is trading around the $50,679 level after a free fall from the daily high of $51,570 during the European.
Bitcoin Price Prediction: Bitcoin (BTC) Heads to the Downside
The Bitcoin price is currently nose-diving below the 9-day moving average. If the price should slump below the support level of $50,000, it is likely to face a downward trend. Moreover, further bearish movement could locate the supports at $45,000, $43,000, and $41,000, making room for BTC to fall even further.
In the meantime, the 9-day moving average may slide below the 21-day moving average as the trading volume could be in support of the bears. On the contrary, if bulls decide to move the price back above the 9-day and 21-day moving averages, BTC/USD may move towards the upper boundary of the channel to locate the resistance levels at $36,000, $38,000, and $40,000.
BTC/USD Medium-term Trend: Ranging (4H Chart)
On the 4-hour chart, the Bitcoin price remains below the 9-day and 21-day moving averages and the immediate support is likely to come at the $50,500 level. The price may likely fall below this level if the bears continue to dominate the market.
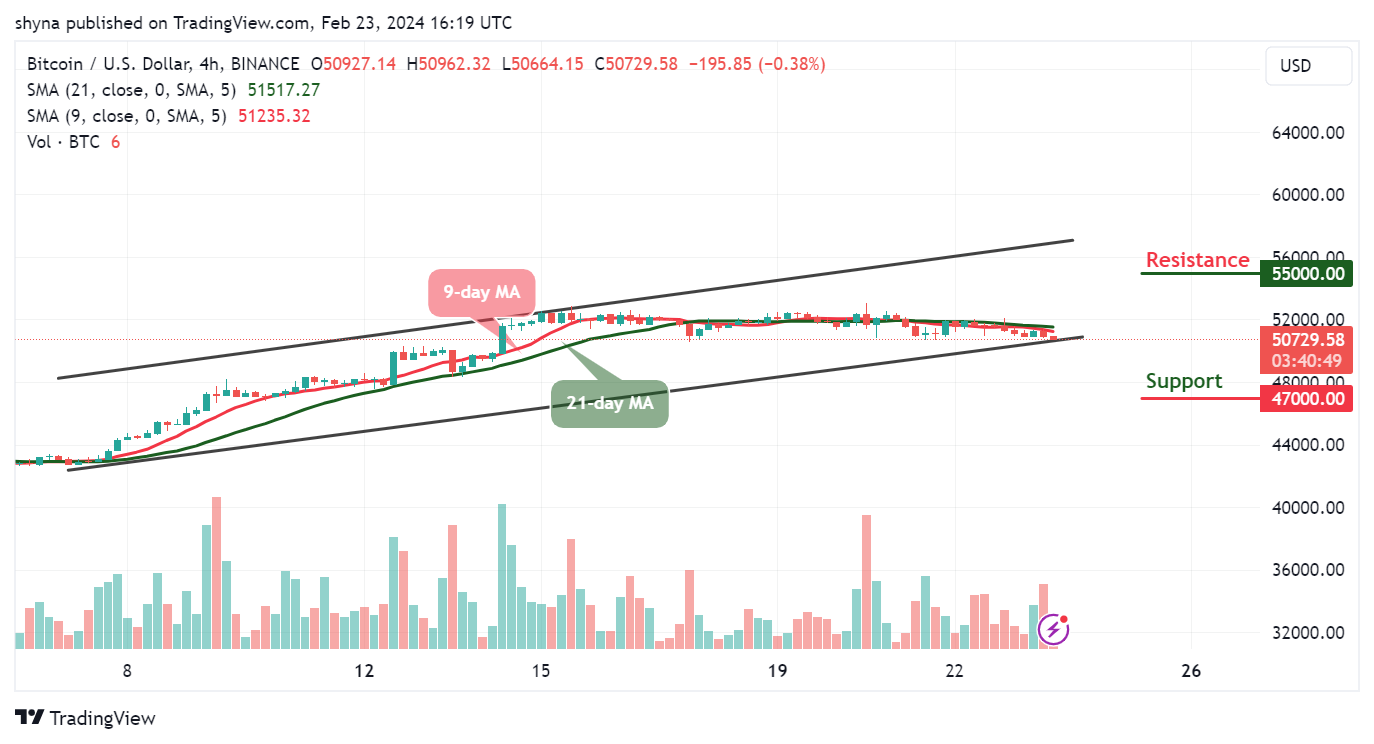
However, a further bearish movement could hit the critical support at the $47,000 level and below, while the resistance is located above the moving averages at the resistance level of $55,000 and above. Meanwhile, the Bitcoin price is currently moving on the positive side if the market price crosses above the moving averages.
You can purchase Bitcoin here. Buy BTC