Bitcoin Price Prediction: BTC/USD Prints Bullish Breakout Above $31k Level
Don’t invest unless you’re prepared to lose all the money you invest. This is a high-risk investment and you are unlikely to be protected if something goes wrong. Take 2 minutes to learn more
Bitcoin Price Prediction – July 6
The Bitcoin price prediction shows that BTC is trading bullishly, and the king coin could move to break to the upside.
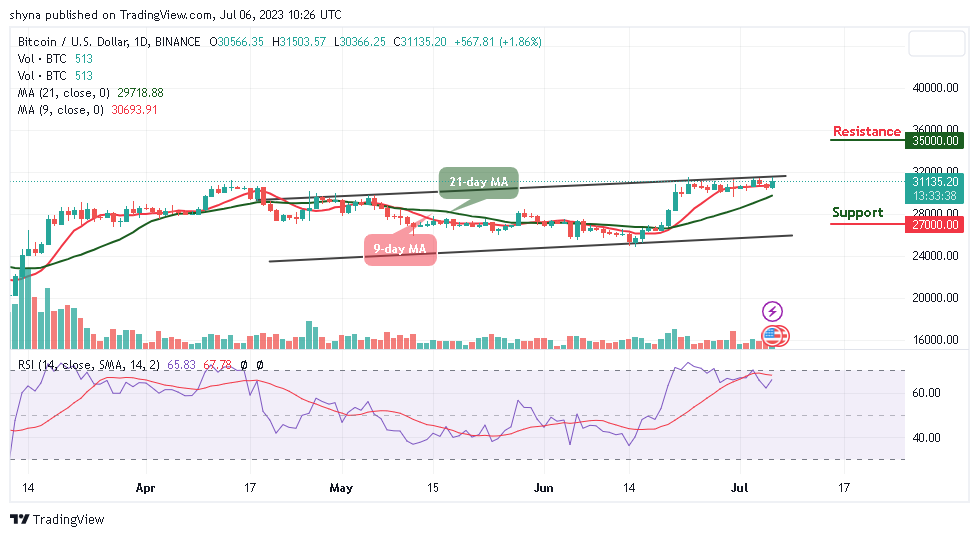
BTC/USD Long-term Trend: Ranging (Daily Chart)
Key levels:
Resistance Levels: $35,000, $36,000, $37,000
Support Levels: $27, $26,000, $25,000
According to the daily chart, BTC/USD is showing a positive sign and might rise further above the $31,500 resistance. However, the Bitcoin price could move with strong bullish momentum after a sustainable break above the upper boundary of the channel.
Bitcoin Price Prediction: Bitcoin (BTC) Would Move to the Upside
The technical indicator Relative Strength Index (14) shows that the Bitcoin price is ready for upward movement as the signal line hovers above the 60-level. Meanwhile, the Bitcoin price could struggle around the resistance level of $32,000, suggesting that the king coin could retreat a little bit, before attempting to break higher again.
On the upside, if the bulls increase the buying pressure, BTC/USD could hit the resistance level of $32,000. However, a daily close above this could lift the price to the resistance levels of $35,000, $36,000, and $37,000. In other words, Bitcoin could retreat and slide toward the lower boundary of the channel, if it breaks below the moving averages, the critical supports could be found at $27,000, $26,000, and $25,000 respectively.
BTC/USD Medium-term Trend: Ranging (4H Chart)
According to the 4-hour chart, BTC/USD is trading above the 9-day and 21-day moving averages as the coin moves toward the upper boundary of the channel, crossing above it could touch the resistance level of $32,500 and above. Meanwhile, the Bitcoin price is likely to range-bound around the upper boundary of the channel as buyers may keep the position intact.
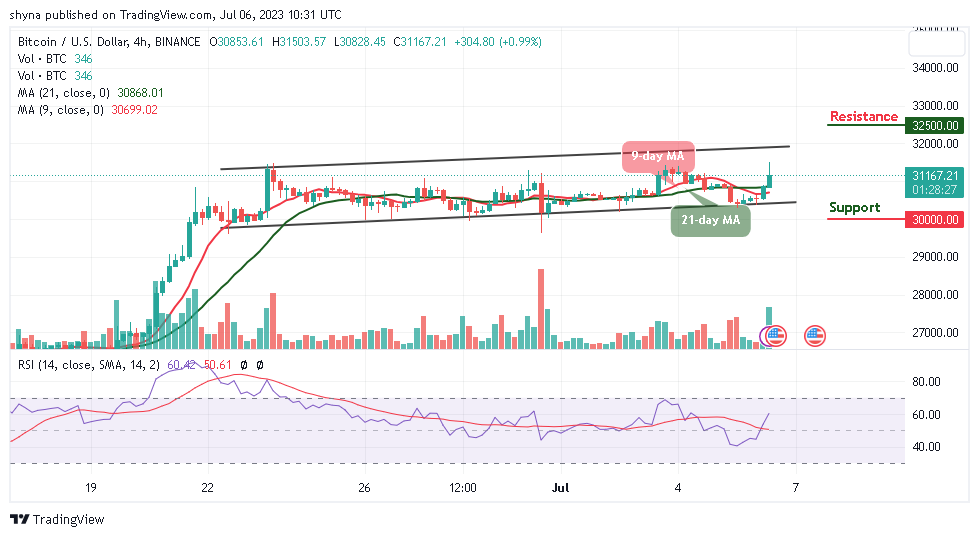
Furthermore, the Relative Strength Index (14) shows that the BTC price may remain on the upside as the signal line moves to cross above the 60-level. On the contrary, if the coin retreat below the 9-day and 21-day moving averages; the support level of $30,000 and below may be located.
You can purchase Bitcoin here. Buy BTC