Bitcoin Price Prediction: BTC/USD Trades Around $42,896; Time to Resume Higher?
Estimated Reading Time: 3 minutes
Don’t invest unless you’re prepared to lose all the money you invest. This is a high-risk investment and you are unlikely to be protected if something goes wrong. Take 2 minutes to learn more

Bitcoin Price Prediction – December 15
The Bitcoin price prediction shows that BTC will begin to show positive signs, and it is likely to accelerate further in the near term.
BTC/USD Long-term Trend: Bullish (Daily Chart)
Key levels:
Resistance Levels: $48,000, $50,000, $52,000
Support Levels: $38,000, $36,000, $34,000
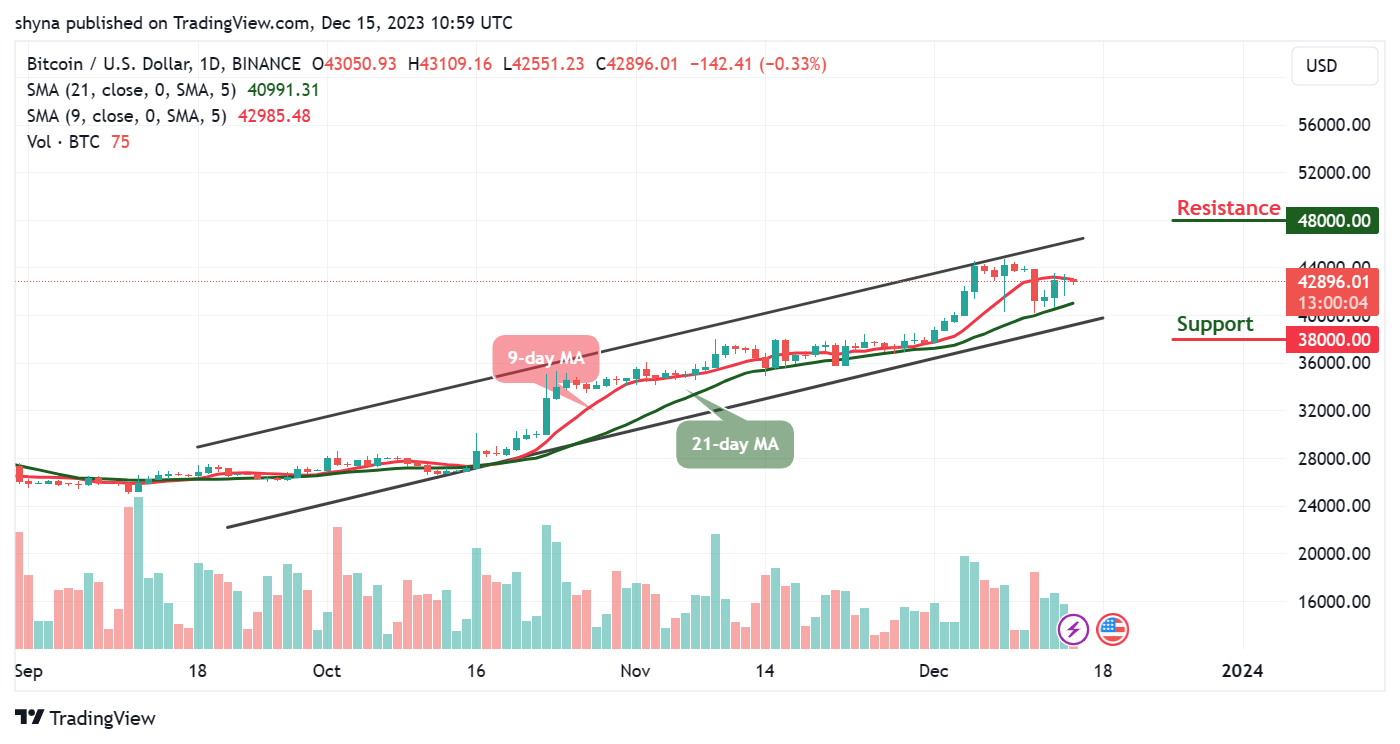
According to the daily chart, BTC/USD breaches $44,000 as the king coin faces the upper boundary of the channel. The first digital crypto is seen consolidating around the 9-day and 21-day moving averages at $42,896. Moreover, the Bitcoin price is within touching distance of forming a new all-time high above the previous high of $44,000, which is quite remarkable.
Bitcoin Price Prediction: Bitcoin (BTC) Prepares for the Upside
According to the daily chart, the Bitcoin price is likely to face the upper boundary of the channel as the price gets ready for a new bullish signal. With the look of things, one could say that the long-term could favor the bulls if the daily close produced a bullish candle with eyes now set on the daily resistances at $48,000, $50,000, and $52,000 respectively.
Furthermore, any drop from the current level could lead to critical support below the lower boundary of the channel. In case BTC drops and touches the low of $41k support, then the coin can rely on the long-term support levels at $38,000, $36,000, and $34,000. Moreover, the 9-day moving average is hovering above the 21-day moving average, suggesting more bullish signals.
BTC/USD Medium-term Trend: Ranging (4H Chart)
According to the 4-hour chart, the Bitcoin price is seen trading above the 9-day and 21-day moving averages at $42,814. However, BTC/USD will begin to maintain its bull run above the moving averages.
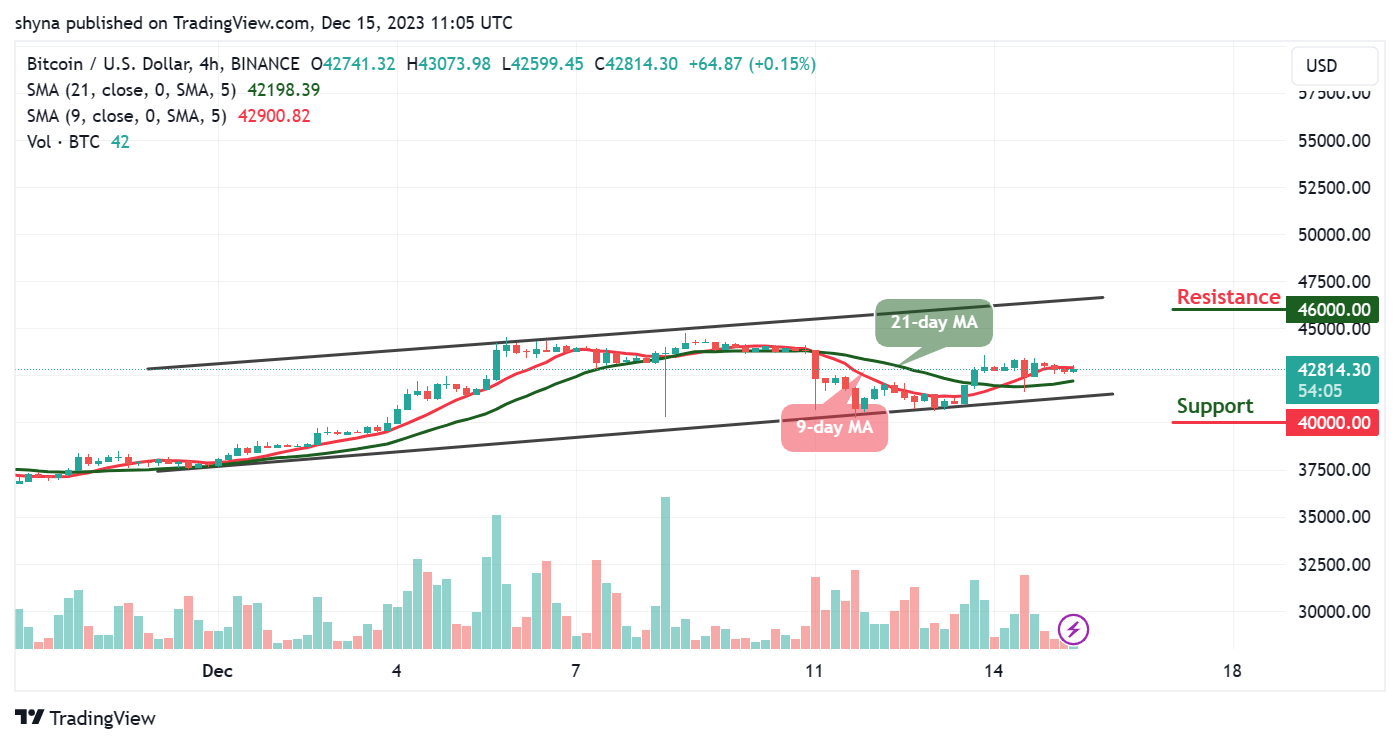
However, BTC may take a downward move if the bulls fail to push the price higher and the coin may breach below the moving averages which could reach another support at $40,000 and below. Nevertheless, if the bulls find a decent resistance level of around $45,000, the coin may continue the bullish movement toward the upper boundary of the channel to hit the resistance level of $46,000 and above.
You can purchase Bitcoin here. Buy BTC