API3 Market (API3/USD): Bullish Recovery Tests the $1.50 Resistance Level
Estimated Reading Time: 3 minutes
Don’t invest unless you’re prepared to lose all the money you invest. This is a high-risk investment and you are unlikely to be protected if something goes wrong. Take 2 minutes to learn more
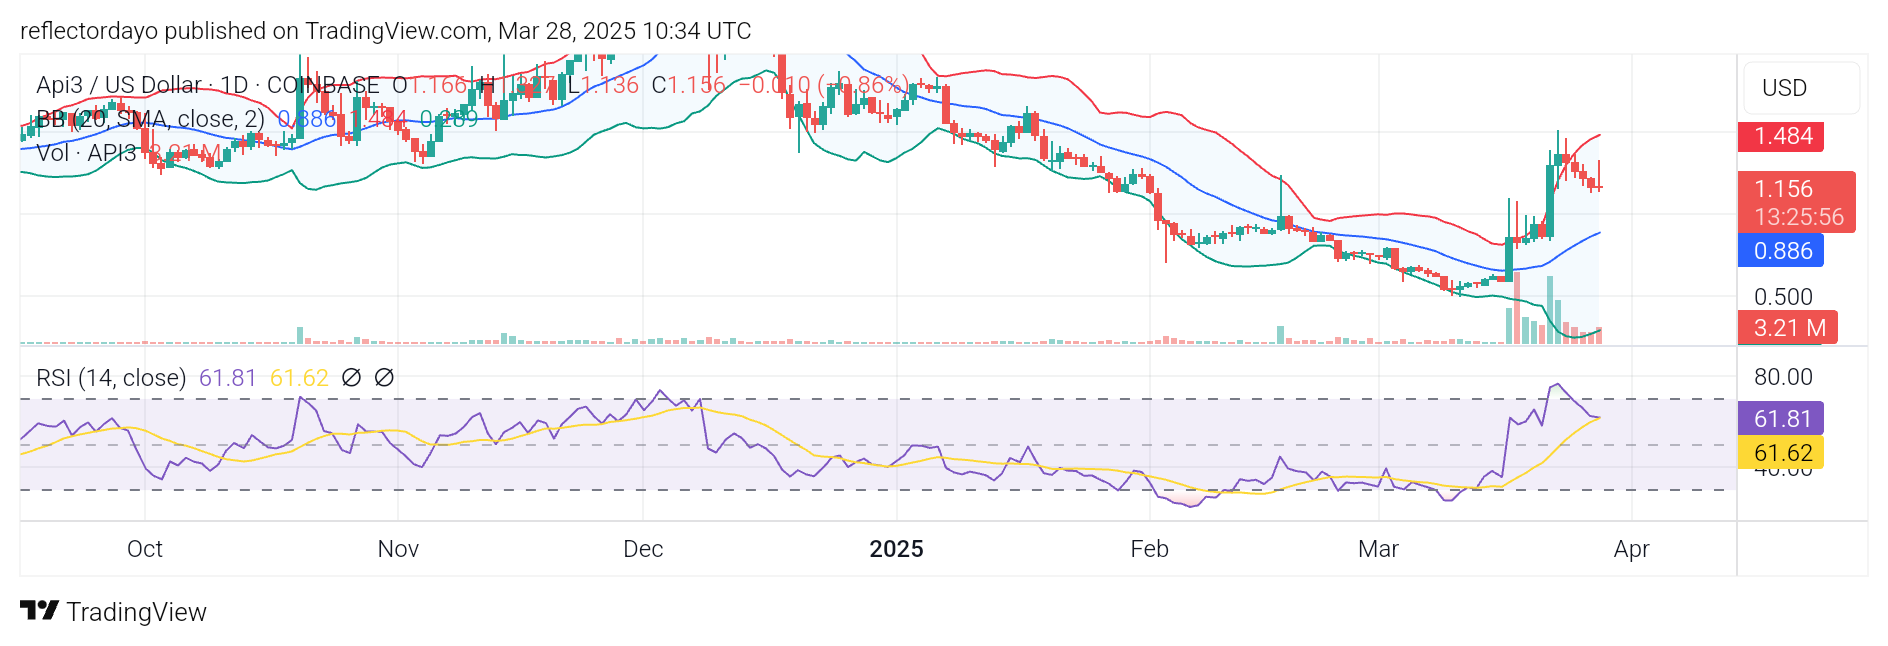
The month of March has significantly supported a bullish recovery in the API3 market. After testing support at the $0.50 price level, the market reversed to the upside, gaining momentum toward the $1.50 price level. By March 23, the bullish recovery peaked slightly above $1.50, prompting traders to take profits, which led to a minor correction in price action.
The $1.50 price level is a critical resistance zone due to the prolonged battle between bulls and bears for market dominance. Bears have maintained slight control over this level, making it a decisive point for future price action. Notably, the last major bullish rally that peaked at $2.80 originated from this level.
Currently, bulls are seeking higher support around the $1.164 level, where a new support zone appears to be forming. The key question remains: Will this support level hold? Let’s analyze the indicators.
API3 Market Data
- API3/USD Price Now: $1.20
- API3/USD Market Cap: $107 million
- API3/USD Circulating Supply: 86 million
- API3/USD Total Supply: 147.8 million
- API3/USD CoinMarketCap Ranking: #315
Key Levels
- Resistance: $1.50, $2.00, and $2.50
- Support: $1.00, $0.90, and $0.80
The API3 Market Through the Lens of Indicators
Upon analyzing the Relative Strength Index (RSI), it becomes evident that the market has been in the overbought region due to previous strong buying sentiment. The ongoing API3 market price correction could be a natural response to the expected pullback that typically follows such market behavior when the RSI enters the overbought zone. However, the fact that the price has started to seek a higher support level around the $1.164 mark suggests that bullish sentiment may still be present in the current market activity.
Today’s trading session features a shooting star candlestick pattern, which, when it appears at the peak of a price surge, typically signals that the crypto market may be reversing downward. Conversely, when it forms at the end of a downtrend, it often indicates a potential market rebound. The key question now is whether the market will rebound from the $1.164 level since this level appear to be ending a brief price pullback. A closer examination of a shorter time frame could offer additional insights into the likelihood of this scenario.
However, if the price breaks below this critical support level, it could trigger a shift toward bearish sentiment, potentially driving the price down to the $0.55 level—where the bullish recovery began earlier this month.
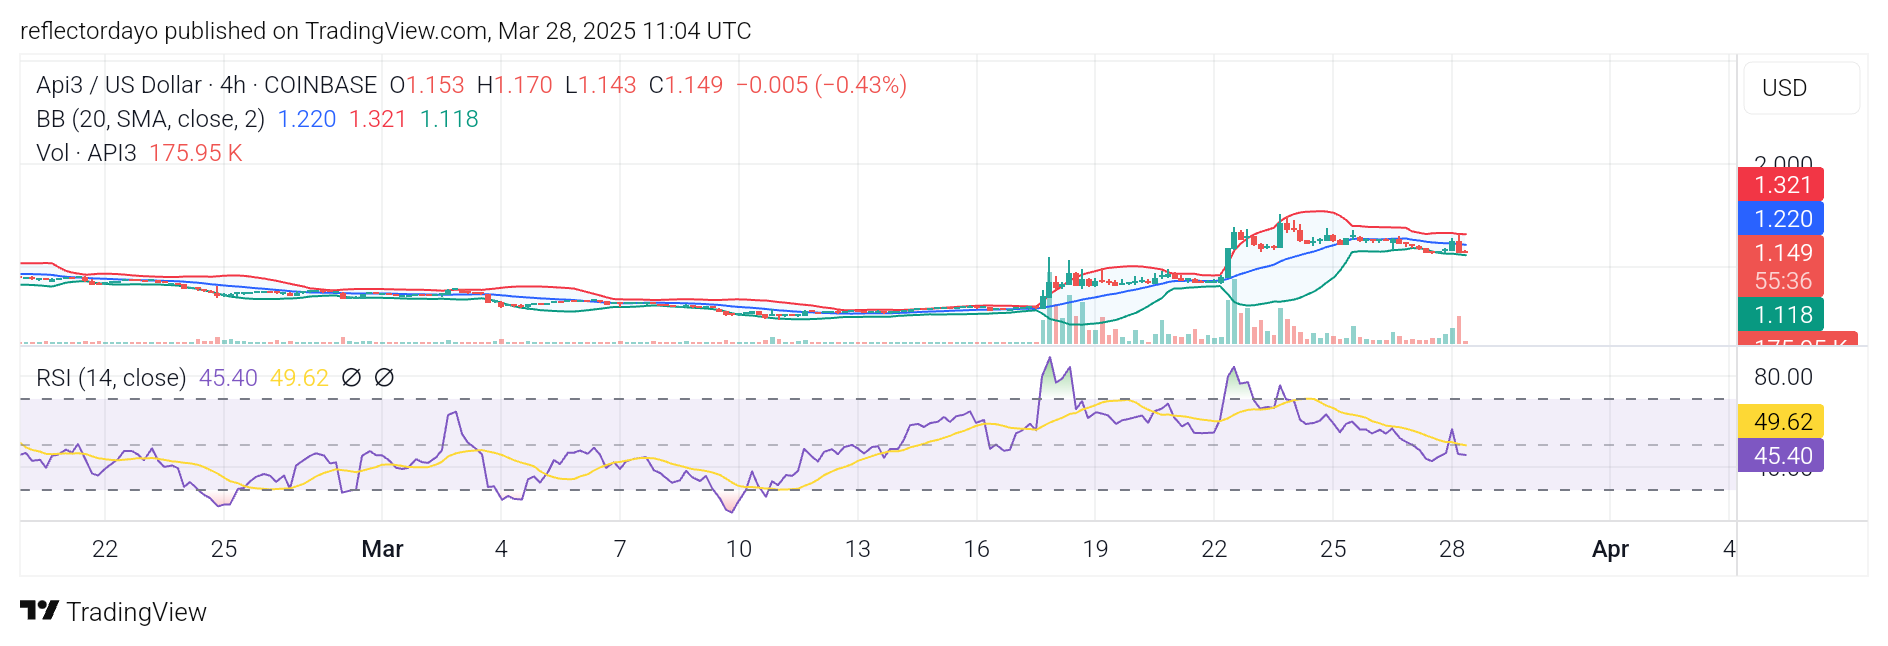
API3/USD Price Prediction: 4-Hour Chart Analysis
Based on the 4-hour chart analysis, it is becoming increasingly clear that the market may consolidate above the 1.00 price level. Following a correction from the recent peak, bullish sentiment has emerged, strengthening above the 1.00 level. This robust bullish momentum has led to the formation of a consolidation phase. The ability of the market to establish such a consolidation trend further suggests the possibility of continued upward movement.