Axie Infinity (AXS/USD) Price Prediction: AXS Coin Major Breakout?
Estimated Reading Time: 3 minutes
Don’t invest unless you’re prepared to lose all the money you invest. This is a high-risk investment and you are unlikely to be protected if something goes wrong. Take 2 minutes to learn more

Axie Infinity is currently undergoing a bullish recovery, with price action now at a critical crossroads around the $1.5 level. This zone is acting as a key test for the ongoing rebound, and a decisive breakout above it is crucial for further upside. So far in the daily trading session, bulls have shown notable strength, pushing the market up to the important $1.5 resistance. However, trading activity has become cautious at this level, as mild profit-taking has triggered a short-term pullback.
Axie Infinity (AXS/USD) Market Data
- AXS/USD Price Now: $1.48
- AXS/USD Market Capitalization: $216 million
- AXS/USD Circulating Supply: 168.96 million AXS
- AXS/USD Total Supply: 270 million AXS
- AXS/USD CoinMarketCap Ranking: #130
AXS coin Major Breakout? AXS Coin Price Prediction Feb 9, 2026
For several sessions, AXS has been trading firmly within a bearish zone, with price action remaining below two key moving averages. However, over the past 24 hours, the market has posted a strong recovery, gaining approximately 20% so far today and breaking above these moving averages. Despite this rebound, bearish pressure near these levels has significantly slowed upward momentum, preventing the price from making further progress to the upside. Bulls are still actively contending in this zone, which has helped the market remain supported. All eyes are now on the market’s next decisive move.
Key Levels to Monitor
- Resistance: $1.60, $1.70, $1.80
- Support: $1.40, $1.35, $1.30
Axie Infinity Analysis: Technical Viewpoint
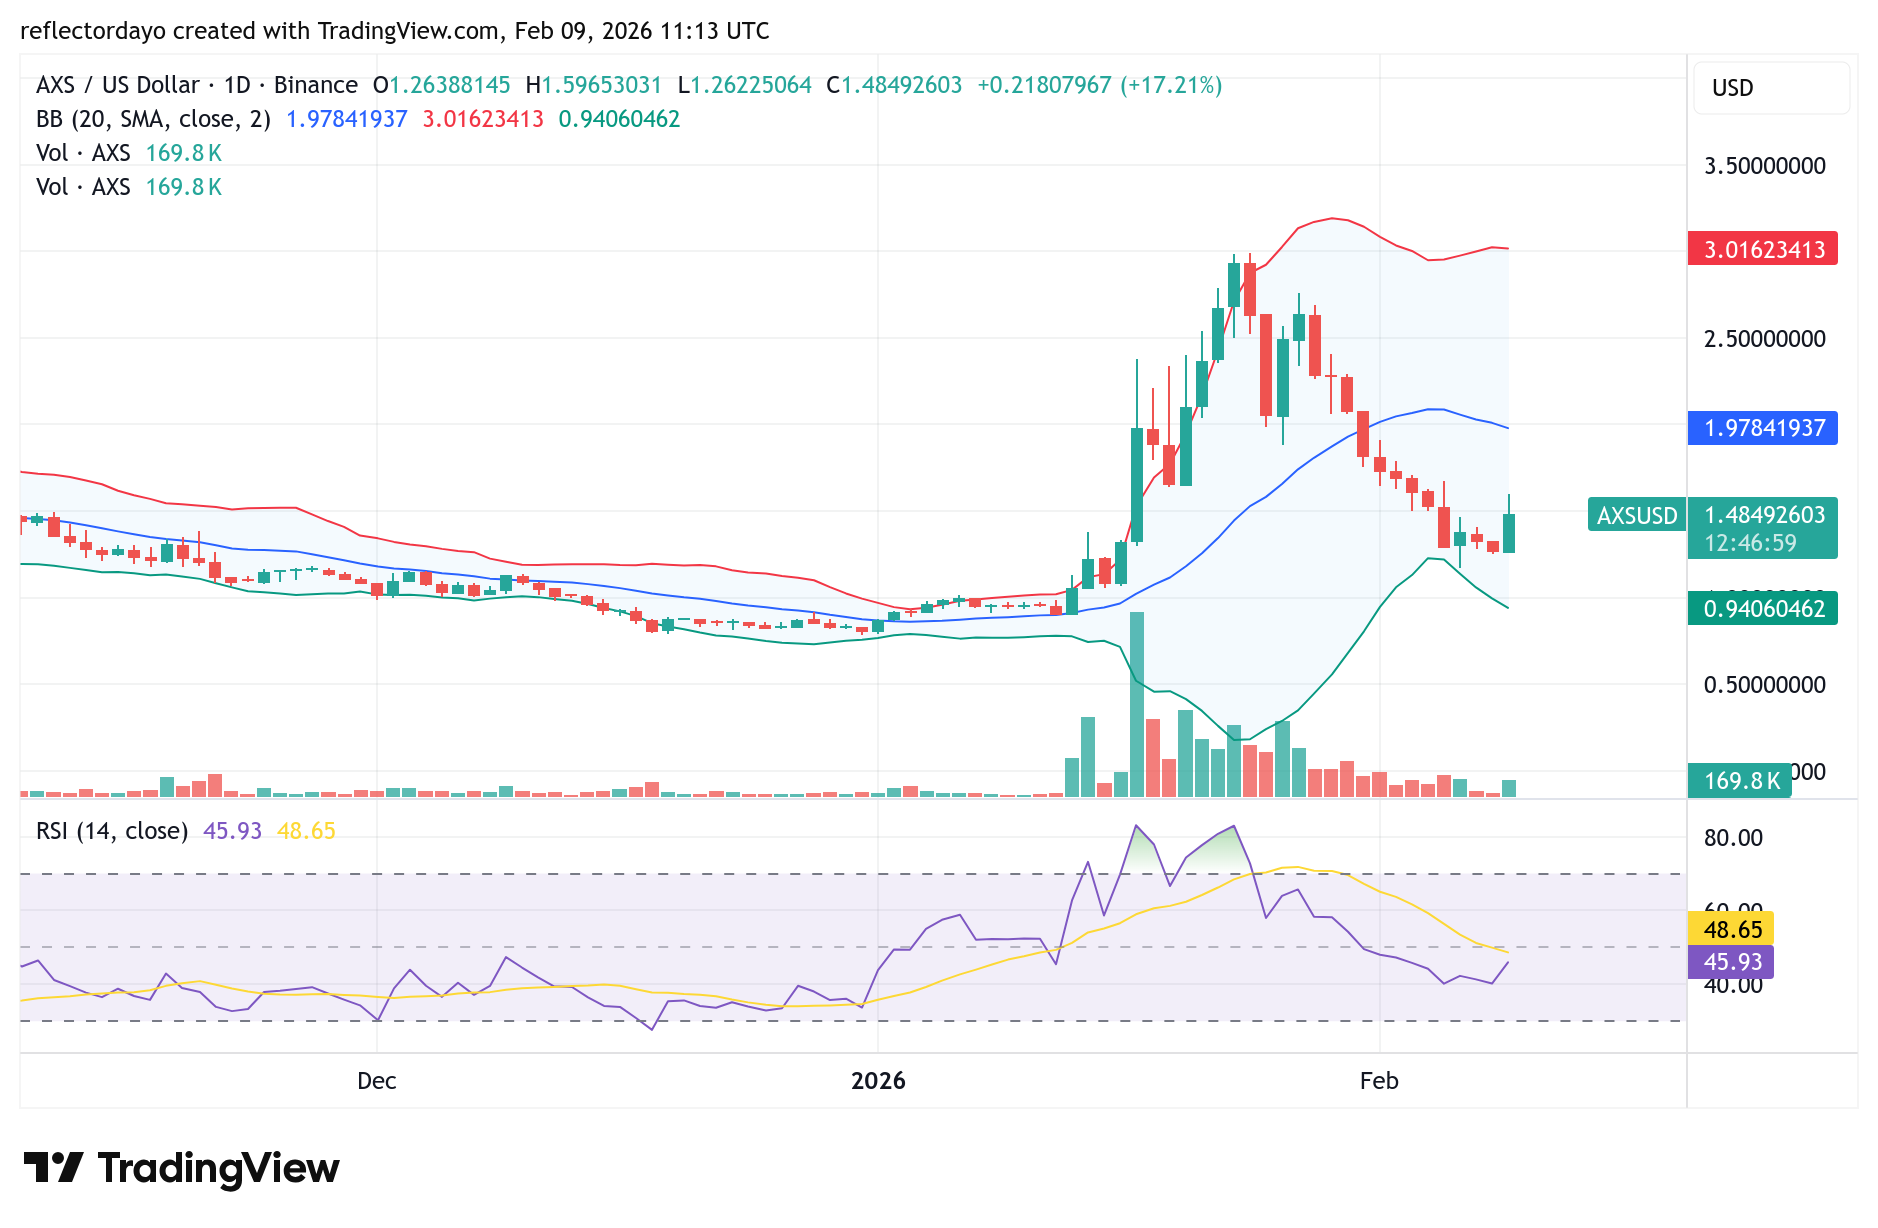
Today’s market highlights a notable shift in Axie Infinity’s price action, as a bullish recovery emerges after a prolonged bearish trend that began at the $3.00 level. The market had previously surged strongly, with the bull run peaking near $3.00, before giving way to sustained selling pressure in the days that followed. This decline continued until buyers found support around $1.25. As a result, nearly all the gains from the prior bullish run—which initially started near the $1.00 level—have been erased. Currently, bulls are attempting to reclaim the $1.50 price level, and the market’s reaction at this zone is likely to determine the next directional move.
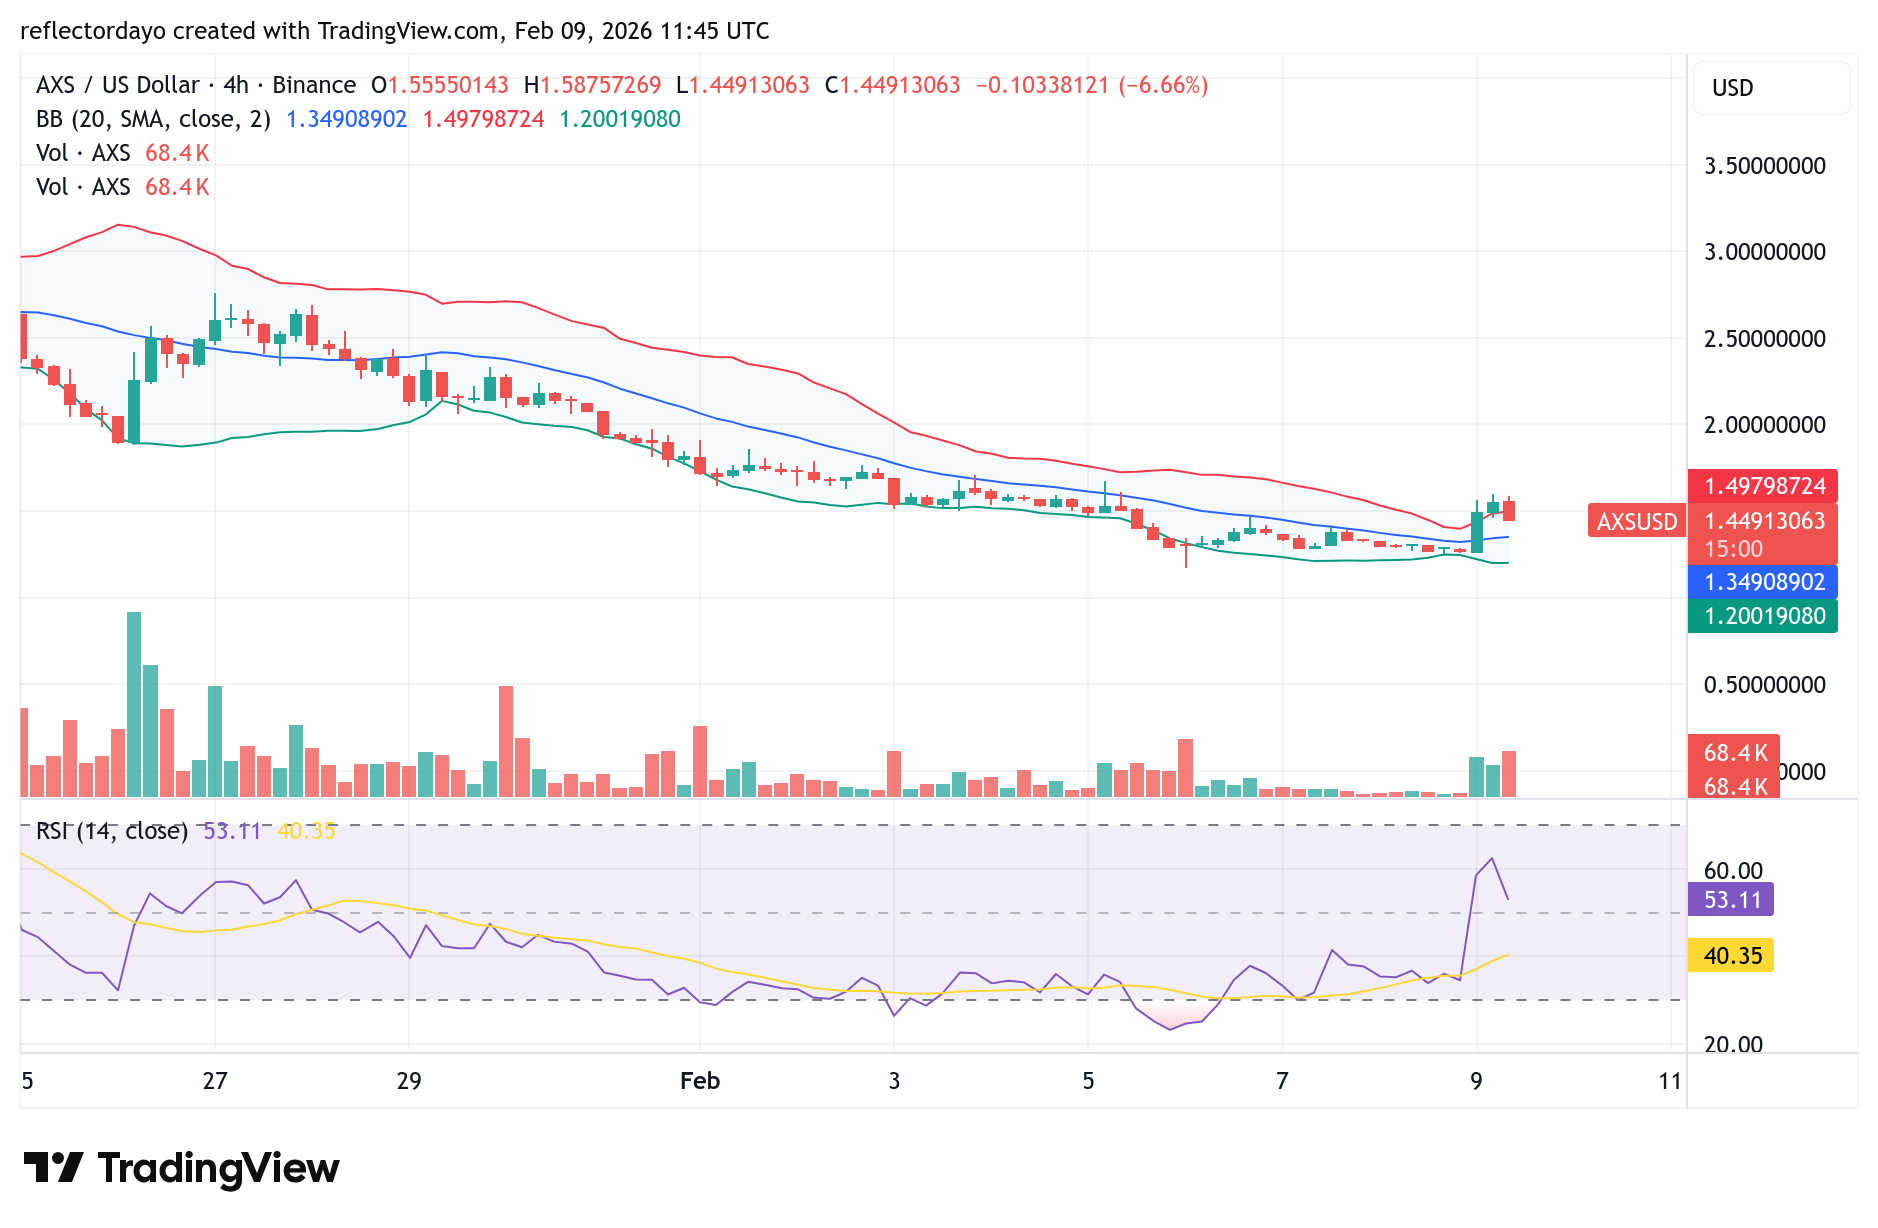
AXS/USD 4-Hour Chart Outlook
Zooming into the 4-hour chart, the market reveals a stalemate between demand and supply at the critical $1.50 price level. The trading volume indicator shows substantial trader interest; however, with neither side in clear control, volume may begin to decline. This equilibrium between buyers and sellers suggests that the market could consolidate around this level before ultimately establishing its next directional move.