Balancer (BAL/USD) Breaks Out of Consolidation as Bullish Momentum Builds
Estimated Reading Time: 3 minutes
Don’t invest unless you’re prepared to lose all the money you invest. This is a high-risk investment and you are unlikely to be protected if something goes wrong. Take 2 minutes to learn more

Balancer (BAL/USD) has initiated a notable bullish shift during today’s trading session, suggesting a potential reversal in market sentiment. This development follows a prolonged period of price consolidation near the $0.95 level.
The upward move appears to have been set in motion as early as April 8, when bearish pressure lost steam around the $0.82 support zone. Since then, buyers gradually gained control, pushing the crypto signal from $0.82 up to $0.95. Today’s breakout above this range signals renewed bullish momentum and could mark the beginning of a sustained recovery phase.
Balancer Market Data
- BAL/USD Price Now: $1.32
- BAL/USD Market Cap: $81.2 million
- BAL/USD Circulating Supply: 63.2 million BAL
- BAL/USD Total Supply: 68.2 million BAL
- BAL/USD CoinMarketCap Ranking: #329
Key Levels
- Resistance: $1.50, $2.00 and $2.50
- Support: $1.00, $0.90, and $0.80
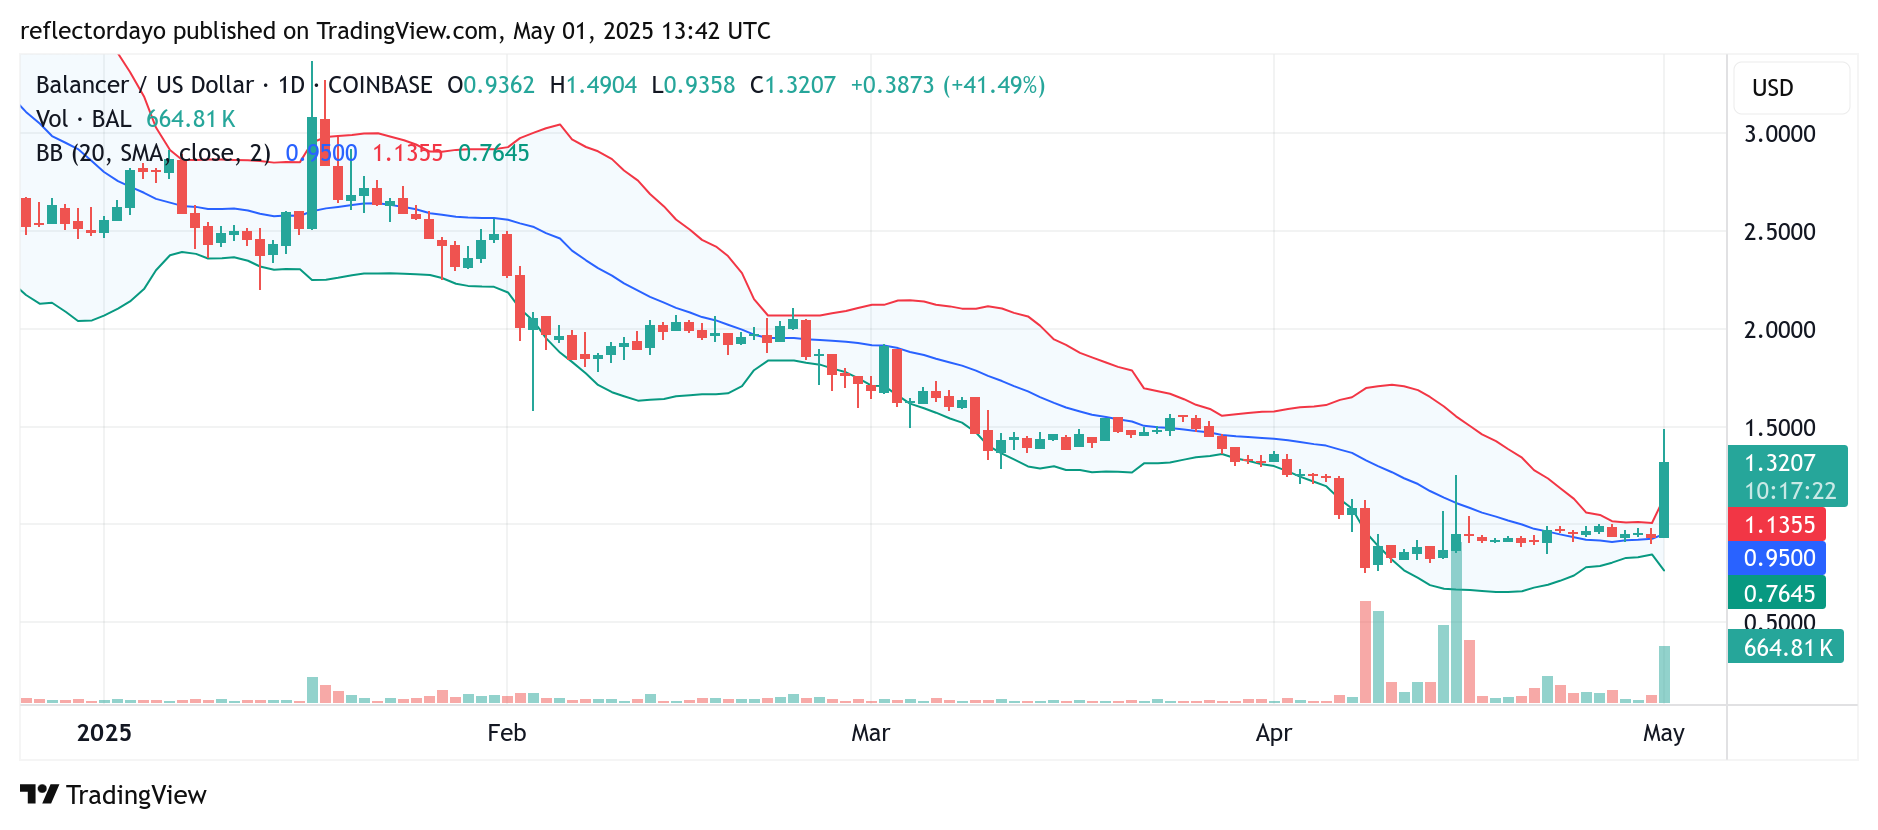
Balancer (BAL/USD) Daily Chart Outlook: Bullish Momentum Faces First Major Resistance at $1.50
Since peaking at the $4.00 level late last year, Balancer (BAL/USD) has been in a sustained downtrend, with intermittent bullish attempts observed at key levels such as $2.50, $2.00, and $1.50. Recently, the market regained upward momentum after reclaiming the $1.00 threshold, pushing higher toward the next critical resistance at $1.50.
However, this price level now presents a significant challenge for the bulls. The spike in liquidity has triggered increased volatility, as reflected by the long upper shadows on today’s candlestick—an indication of profit-taking or early signs of rejection at this resistance zone.
A closer look at the daily chart reveals that since April 8, the market has been consolidating just below $1.00, accompanied by a steady increase in trading volume. The volume histogram displayed consistent growth during this period, signaling renewed trader interest as prices dipped below key psychological levels.
This strong volume support suggests that the recent bullish recovery could extend further, provided price action manages to establish firm support above $1.50.
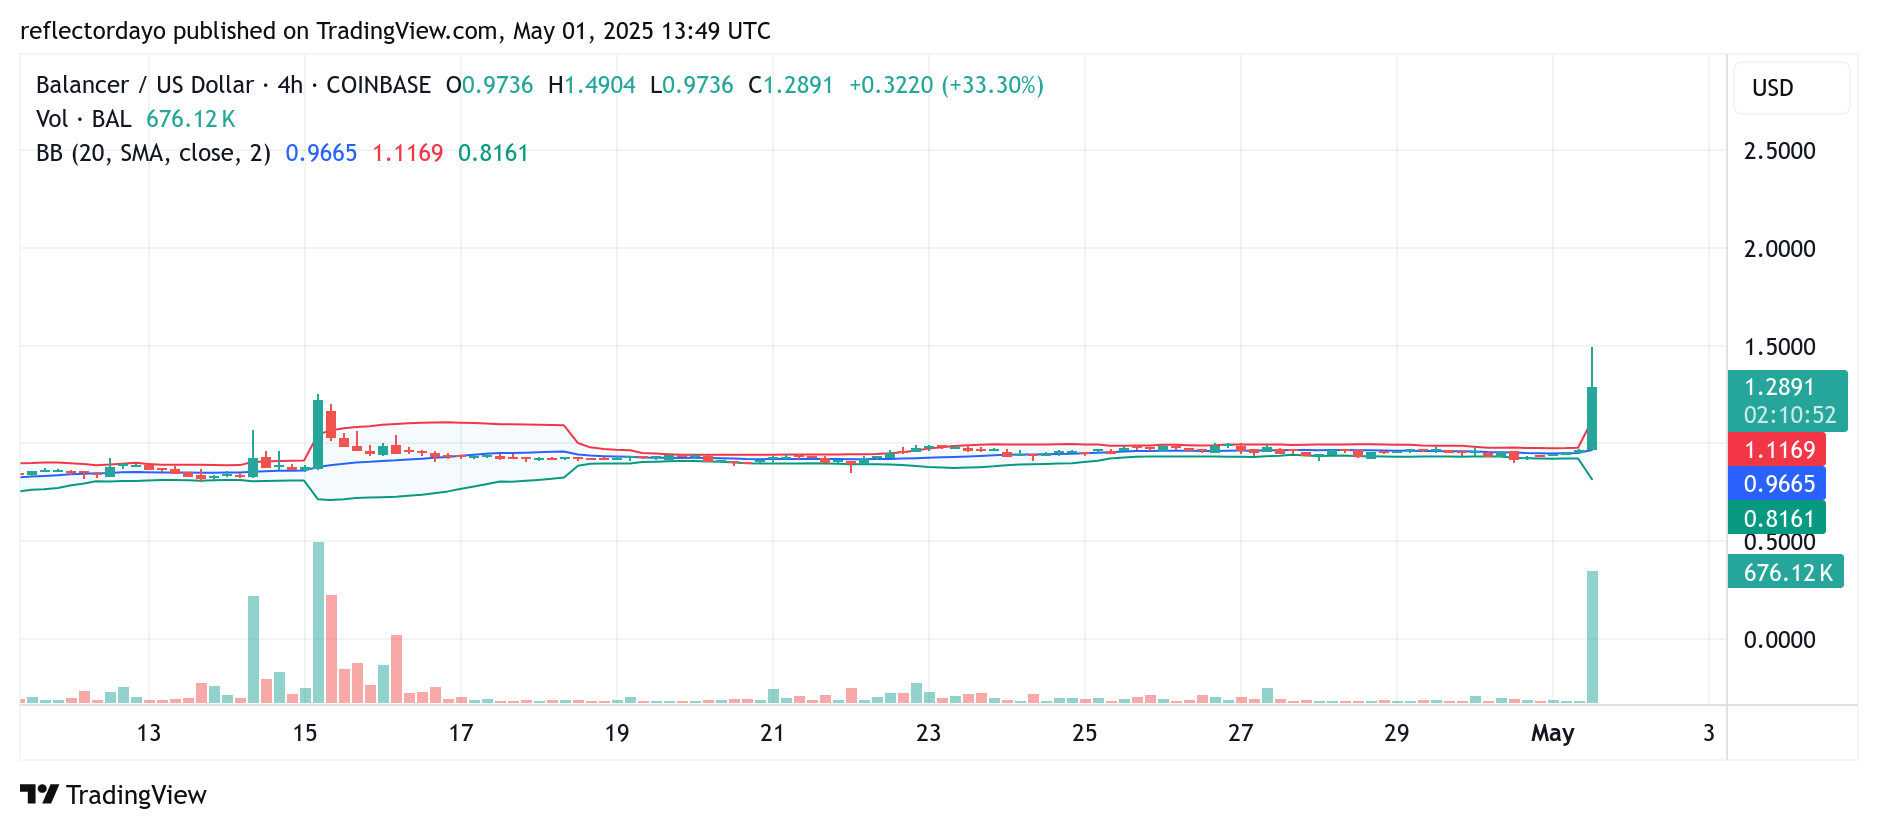
BAL/USD 4-Hour Chart Analysis: Bullish Sentiment Builds as Price Approaches Key Resistance
Recent price action on the 4-hour chart suggests that early bullish activity may be driven by traders who accumulated Balancer (BAL/USD) during its consolidation phase between the $0.80 and $0.90 range. With strong support established in that zone, confidence appears to have grown among investors that the market is unlikely to fall further in the short term.
This growing optimism has fueled upward momentum, pushing prices higher toward the $1.50 resistance level. A decisive breakout above $1.50 could serve as a catalyst for further bullish movement, attracting additional buying interest and reinforcing the upward trend.