Balancer (BAL/USD) Bullish Rebound Eases Selling Pressure
Estimated Reading Time: 3 minutes
Don’t invest unless you’re prepared to lose all the money you invest. This is a high-risk investment and you are unlikely to be protected if something goes wrong. Take 2 minutes to learn more

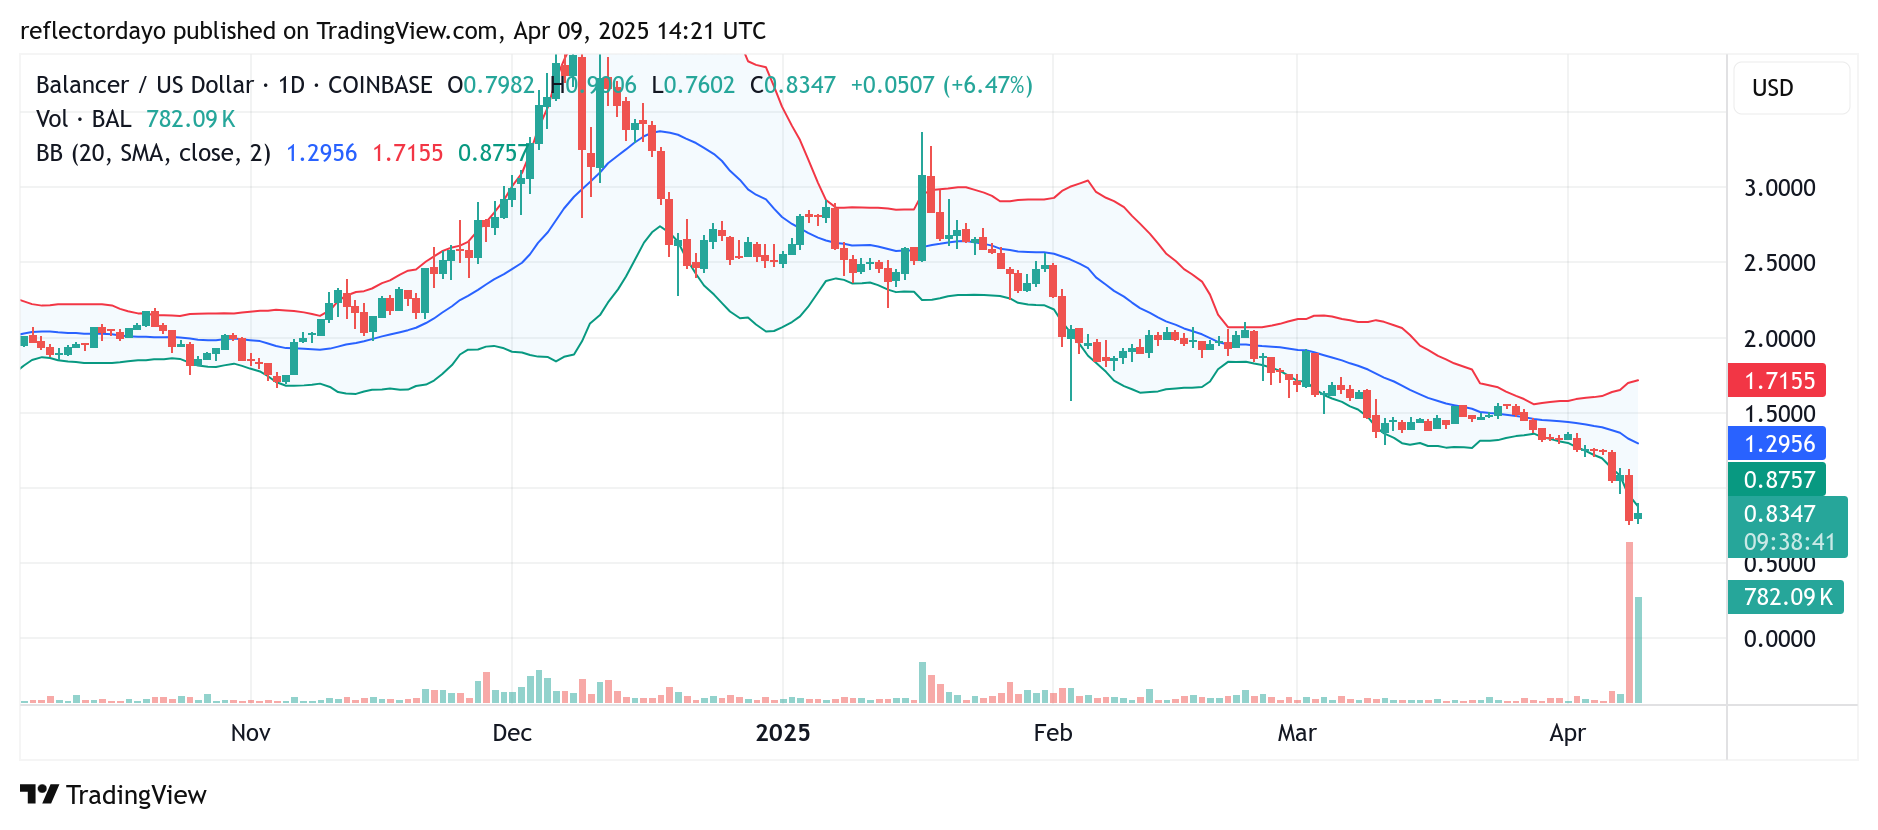
In the previous daily trading session, the Balancer (BAL) market experienced heightened selling pressure, leading to a sharp decline in price. The market broke down from above the critical $1.00 support level, triggering increased bearish momentum as it slipped below this key threshold. The bearish run continued until buyers stepped in around the $0.78 level, where a bullish intervention began to halt further downward movement and stabilize the market.
Balancer Market Data
- BAL/USD Price Now: $0.84
- BAL/USD Market Cap: $52.9 million
- BAL/USD Circulating Supply: 62.9 million BAL
- BAL/USD Total Supply: 67.9 million BAL
- BAL/USD CoinMarketCap Ranking: #444
Key Levels
- Resistance: $1.10, $1.20, and $1.30
- Support: $0.70, $0.60, and $0.50
Technical Outlook on Balancer (BAL/USD): Indicators Signal Potential Reversal Amid Bearish Exhaustion
The Balancer (BAL/USD) market has been predominantly bearish for an extended period. In the previous trading session, the market experienced a surge in bearish liquidity, intensifying downward momentum and breaking below key support levels.
Interestingly, today’s price action appears to be a response to this heightened bearish sentiment, as bullish traders begin to step in, potentially viewing the recent sell-off as overextended. While trading volume remained elevated across both sessions, today’s volume is slightly reduced—likely due to a balance between demand and supply dynamics. This equilibrium has led to price stabilization around the $0.78 mark.
Typically, such hyper-bearish conditions can result in a bullish reversal, as selling pressure begins to lose steam. The current absorption of bearish momentum may be a sign of this transition, suggesting the possibility of a rebound in the crypto signal.
However, it’s important to note that if bears continue to capitalize on the broader downtrend—evident from the consistent formation of lower highs—the market may resume its decline. The $0.80 price level remains a critical area to watch for confirmation of either a bullish reversal or continued bearish dominance.
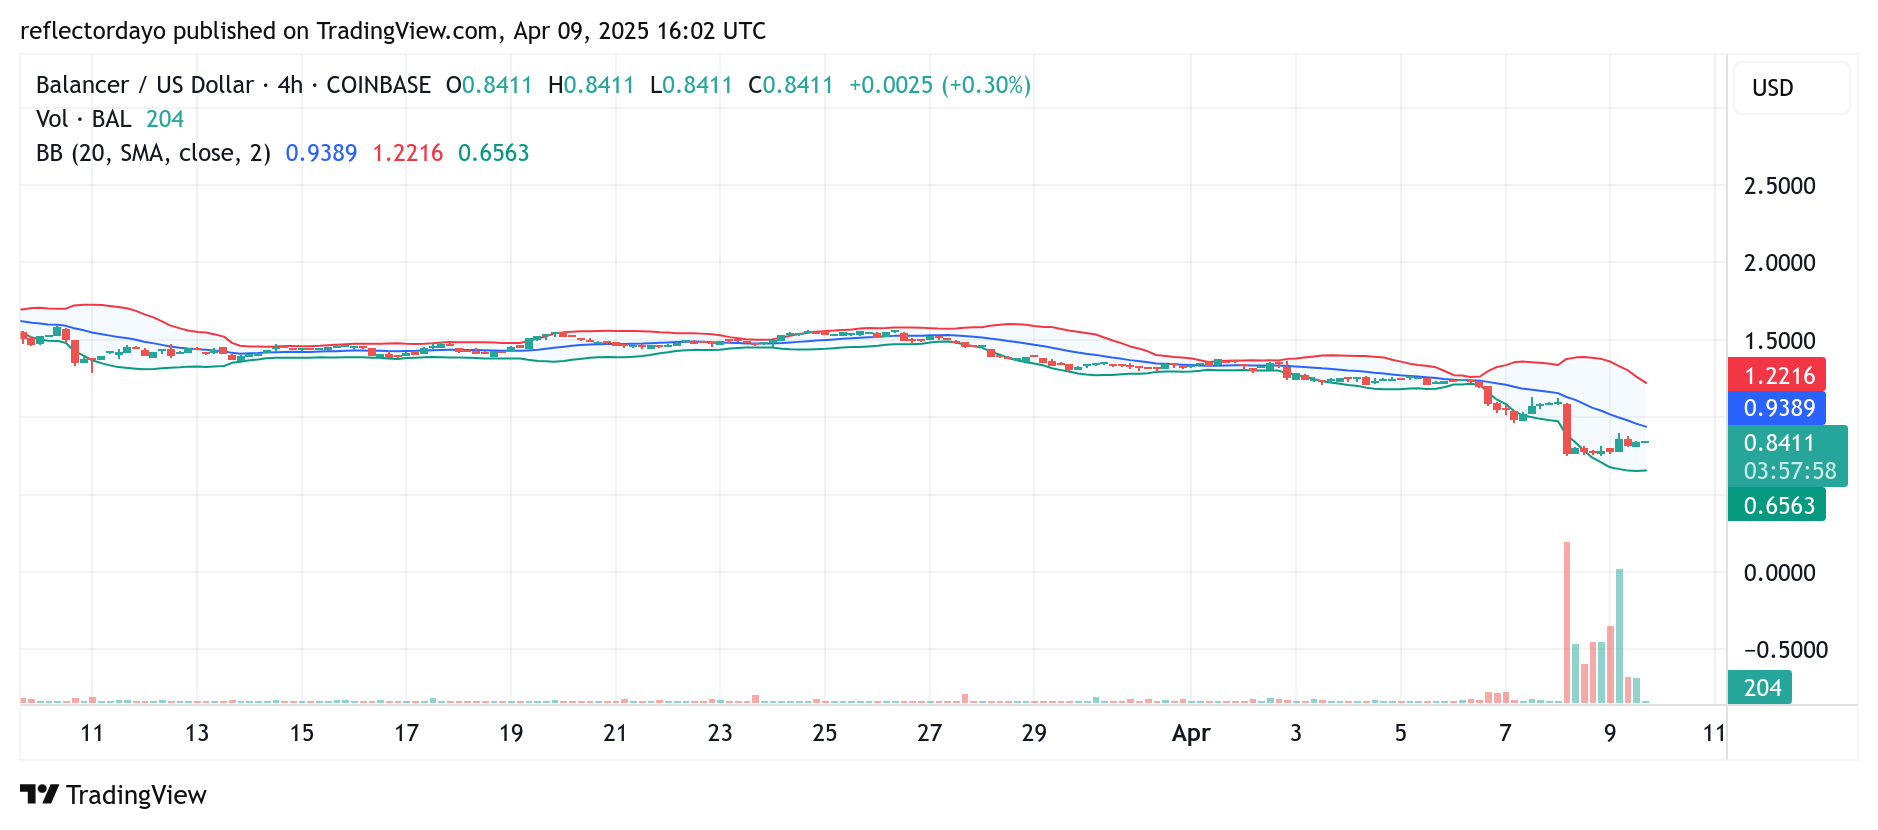
BAL/USD Mid-Term Outlook: 4-Hour Chart Highlights Critical Battle Between Bulls and Bears
The 4-hour chart reveals a key development at the $0.78 price level, where bullish activity is attempting to absorb ongoing bearish pressure. Price action remains in consolidation, reflecting a temporary equilibrium between opposing market forces.
Two potential scenarios are unfolding: Given that $0.78 lies within bullish territory, buyers may continue to defend this level, gradually weakening bearish momentum and possibly paving the way for a bullish breakout. On the other hand, bears could capitalize on the prevailing downtrend and the pattern of lower lows, leveraging overall market sentiment to push prices even lower.
This tug-of-war at $0.78 will likely determine the next directional move. Traders should monitor this level closely for signs of either bullish continuation or renewed bearish dominance.