Bitcoin (BTC/USD) Strives to Establish a Stronghold at $100,000
Estimated Reading Time: 3 minutes
Don’t invest unless you’re prepared to lose all the money you invest. This is a high-risk investment and you are unlikely to be protected if something goes wrong. Take 2 minutes to learn more
Since November, the $100,000 price threshold has been a significant stronghold, repeatedly halting Bitcoin’s bullish momentum. Since November 21, the market has consistently traded within a steady price channel between the $90,000 and $100,000 levels. Notably, since reaching this critical threshold, price action has remained above the 20-day moving average, underscoring the underlying strength of the bulls. However, their hesitation and indecision at the $100,000 level suggest a lack of conviction to push beyond this key resistance zone.
Bitcoin Market Data
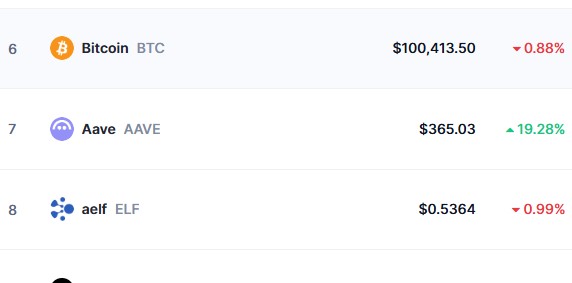
- BTC/USD Price Now: $99,860.96
- BTC/USD Market Cap: $1.98 trillion
- BTC/USD Circulating Supply: 19.8 million BTC
- BTC/USD Total Supply: 19.8 million BTC
- BTC/USD CoinMarketCap Ranking: #1
Key Levels
- Resistance: $105000, $110000, and $115000
- Support: $90000, $85000, and $80000.
The Bitcoin Market Through the Lens of Indicators
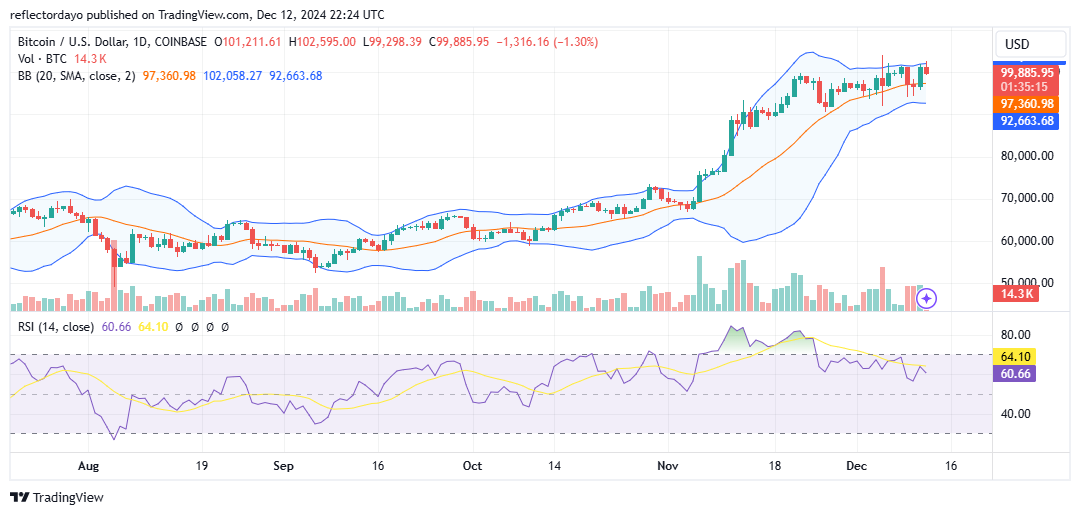
Taking a closer look at the Bitcoin market today, price movements have been minimal around the critical $100,000 level. The market is exhibiting a period of consolidation at this psychologically significant threshold. Since breaking into the $90,000–$100,000 price channel, Bitcoin has displayed resilience, consistently trading above the 20-day moving average. This trend highlights ongoing bullish momentum, despite challenges in breaking and sustaining levels above $100,000.
Today’s daily chart features a small bearish candlestick, signaling indecision among the crypto traders. While the price briefly dipped below $100,000 to approximately $99,000, this movement lacks the strength to suggest a significant bearish reversal, particularly as price action remains predominantly above the $100,000 mark.
The $100,000 level continues to act as a critical support zone, with the market repeatedly rebounding above it after minor dips, reflecting strong buying interest. Meanwhile, the $102,000 mark is emerging as a key resistance level, as price tests have consistently stalled near this area. A decisive break above $102,000 could reignite bullish momentum and signal further upside potential.
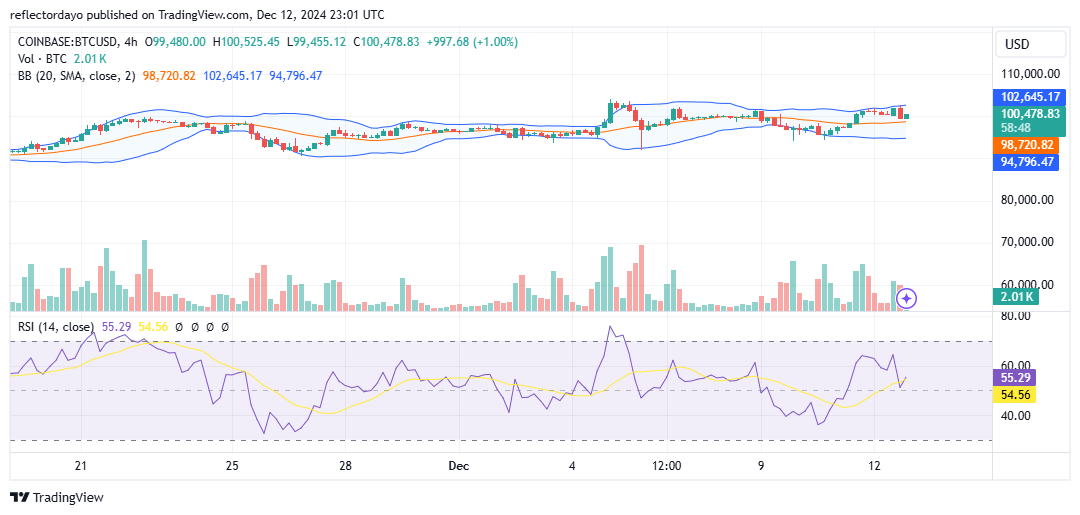
BTC/USD Price Prediction: 4-Hour Chart Analysis
Zooming in on a smaller timeframe, the market appears to be in a period of contention, with price action struggling to maintain momentum around the $100,000 level. The volume indicator reflects strong bullish activity, yet the price remains constrained at this critical juncture.
The proximity of the $102,000 resistance level to the $100,000 support creates a narrow trading range, intensifying the pressure on the market. A decisive breakout above $102,000 would signal the potential for significant upside momentum and likely attract heightened bullish sentiment.
For now, all eyes are on these key price levels. A confirmed break above $102,000 could pave the way for further upward movement and renewed optimism among market participants.