Ethereum (ETH/USDT) Breaks Key Barrier as Buyers Push for Momentum
Estimated Reading Time: 3 minutes
Don’t invest unless you’re prepared to lose all the money you invest. This is a high-risk investment and you are unlikely to be protected if something goes wrong. Take 2 minutes to learn more
ETH Long-term Analysis: Bullish
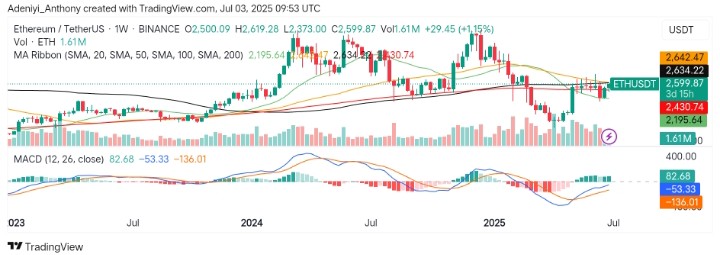
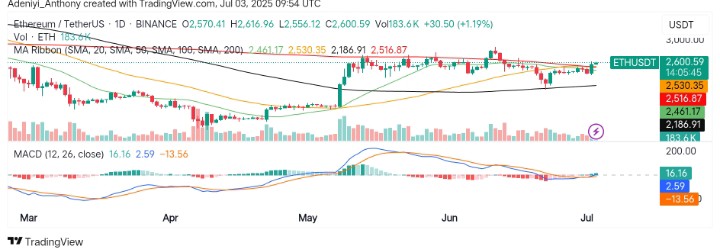
The market for Ethereum against the Tether has shown a fresh move after stabilizing above recent lows around $2,200. However, the price action has broken above a descending trendline and is currently trading above the $2,500 level, showing early signs of a bullish recovery.
Recently, the recent green candles, growing volume, and bullish MACD crossover suggest buyers are regaining control. To this end, if momentum continues, the pair could aim for the next resistance zones, as Ethereum trades at $2,599.87, recording 1.61 million traded volumes for the week already.
Technical Indicators
Major Resistance Levels: $2,634, $2,800, and $3,100
Major Support Levels: $2,430, $2,195, and $1,900
Ethereum Technical Analysis
The analysis of Ethereum against the Tether on the weekly timeframe shows the pair is preparing for a breakout above a multi-week range, confirming a potential reversal. However, the price tends to the north, suggesting more buyers are entering the market.
On the other hand, the MACD seems to be improving as a bullish crossover with an increasing green histogram appears on the chart, showing upward momentum with good support from the bulls.
To this end, if bullish participation increases, a move toward $2,800 may be seen in the near term; otherwise, a break below $2,430 will send the pair’s price back to the previous support.
ETH/USDT Analysis: Can the Bulls Maintain the Current Trend?
On the daily chart, ETH/USDT is showing strong follow-through after the breakout observed on the weekly time frame. However, the price has steadily climbed above several moving averages and is now holding above $2,600.
From another angle, the market sentiment is improving, with increased trading volume and positive MACD movement supporting a short-term bullish trend continuation.
To this end, more participation by the buyers would push the price to the north, and a pullback not beyond $2,530 would encourage more buyers to buy the dip.
You can purchase crypto coins here. Buy LBlock