Ethereum (ETH/USDT) Eyes a Trend Reversal Amid Bollinger Squeeze and MACD Cross
Estimated Reading Time: 3 minutes
Don’t invest unless you’re prepared to lose all the money you invest. This is a high-risk investment and you are unlikely to be protected if something goes wrong. Take 2 minutes to learn more
Ethereum Long-term Analysis: Ranging
The market for Ethereum against the Tether is showing early signs of recovery after a prolonged Sideway movement. As it stands, the price now operates above the mid-band at $2,197, suggesting a shift in momentum.
Recently, the Moving Average Convergence Divergence (MACD) line has crossed above the signal line below zero, indicating a potential trend reversal. However, the overall trend remains cautiously bullish, with a high possibility of continued northbound movement if the $2,520 is breached.
Currently, Ethereum trades at $2,479.80, with 1.84 million traded volumes for the week.
Technical Indicators
Major Resistance Levels: $2,600, $2,800, and $2,995
Major Support Levels: $2,200, $1,900, and $1,400
Ethereum Technical Analysis
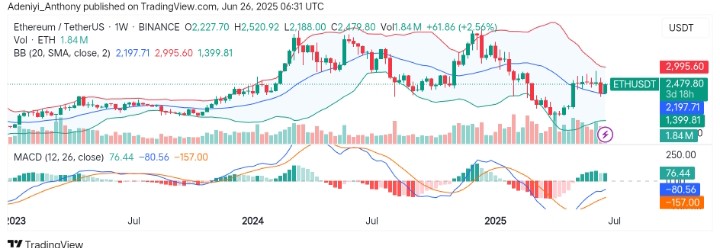
The analysis of Ethereum against the Tether on the weekly timeframe shows the pair appears to be aiming for more gains after previous corrections and prolonged consolidation. However, the price now trade above a dynamic support, signaling a renewed interest. The narrowing bands, on the other hand signals potential upside trajectory.
From another angle, the MACD line has made a bullish cross with greenish histogram bars, indicating increasing bullish strength as volume becomes stable.
To this end, if the price can close above $2,600, with increasing volumes in the near term, $2,995 may be the next profit target as both MACD and Bollinger Bands strengthen.
ETH/USDT Analysis: Continued Downtrend or Trend Reversal?
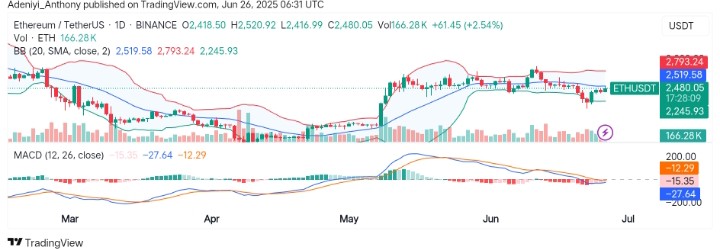
On the daily chart, ETH/USDT appears to be holding above $2,245 after bouncing off the lower Bollinger Band. However, the price is pushing towards $2,519 where the dynamic band is positioned with rising volumes, indicating some bullish market re-entry.
The MACD, on the other hand, in this time zone remains bearish, but hinting at a possible bullish crossover. As it stands, the price action suggests consolidation with a potential bullish breakout if $2,520 is cleared.
To this end, a strong daily close above $2,520 with increasing volume greater than 2.54% change could signal continuation toward $2,995.
You can purchase crypto coins here. Buy LBlock