Ethereum (ETH/USDT) Struggles with Key Resistance Level Despite Short-term Relief
Estimated Reading Time: 3 minutes
Don’t invest unless you’re prepared to lose all the money you invest. This is a high-risk investment and you are unlikely to be protected if something goes wrong. Take 2 minutes to learn more
Ethereum Long-term Analysis: Ranging
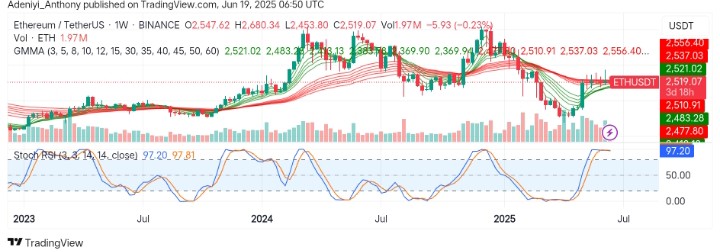
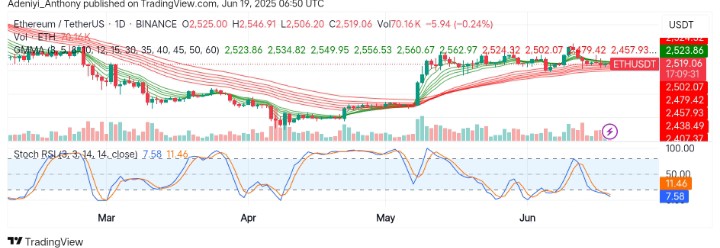
The market for the trading pair Ethereum against the Tether is currently in a relief phase after a severe downtrend since the beginning of 2024. Although the pair has recently seen a rebound from the $2,300 zone, the overall market sphere remains cautious as the price seems to be cutting below the Guppy Multiple Moving Average (GMMA) lines.
Recently, the pair is developing a bearish candlestick and fails to break above key resistance levels with the Stochastic oscillator in an extreme overbought region, suggesting selling pressure is dominating.
Currently, Ethereum trades at $2,521.02, printing a moderate 1.97 million traded volumes for the week.
Technical Indicators
Major Resistance Levels: $2,680, $2,880, and $3,050
Major Support Levels: $2,483, $2,370, and $2,150
Ethereum Technical Analysis
The weekly analysis of Ethereum against the Tether shows the pair’s price is fighting to stay above the long-period EMAs even as the market structure remains bearish with the GMMA sloping to the south.
On the other hand, the volume is unstable and mild, suggesting that despite the declining price, the pair lacks strong conviction as the Stochastic RSI extends its straight line to the right at the overbought region. This indicates the market is cooling off, and more bullish momentum is needed to maintain the structure.
To this end, if more bearish actions are seen at the current level, a move toward $2,370 or lower may be seen. Conversely, otherwise, a move above $2,700 would invalidate the bearish setup.
ETH/USDT Analysis: What’s Next?
On the daily timeframe, ETH/USDT appears to be trading sideways between a converging set of EMAs. This is signaling a compression and indecision as the volume for the timeframe remains low.
From another angle, the Stochastic oscillator beneath the chart suggests a move to the north may be close. However, a bullish crossover has not been confirmed yet.
To this end, whatever happens at $2,500 would decide if a bounce to the north would be recorded or a deeper sell-off towards $2,370 would be seen.
You can purchase crypto coins here. Buy LBlock