Bitcoin Cash (BCH/USD) Market Attempts Downing at the 14-day SMA
Estimated Reading Time: 3 minutes
Don’t invest unless you’re prepared to lose all the money you invest. This is a high-risk investment and you are unlikely to be protected if something goes wrong. Take 2 minutes to learn more

Free Crypto Signals Channel
Bitcoin Cash Price Prediction – February 18
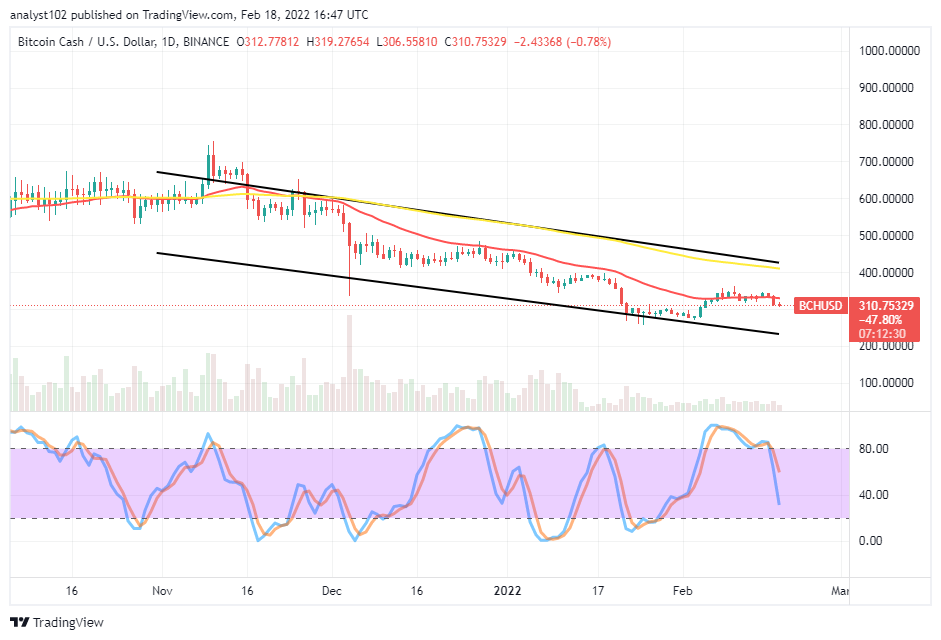
The BCH/USD market attempts downing at the 14-day SMA. The crypto economy has witnessed a high and a low of $319 and $306 at a minute negative percentage rate of 0.78.
BCH/USD Market
Key Levels:
Resistance levels: $350, $400, $450
Support levels: $250, $200, $150
BCH/USD – Daily Chart
The BCH/USD daily chart shows the crypto market attempts downing at the 14-day SMA. The emergence of candlestick has continually been in different smaller lengths, showcasing a downward trend. The upper bearish channel trend line drew alongside the 50-day SMA indicator above the 14-day SMA indicator. The Stochastic Oscillators have slightly crossed southbound closer to the range of 20. And they still point toward the south to indicate a downward force still prevails in the crypto operations as of writing.
Is there an indication backing the return of a downward motion in the BCH/USD trade currently as the crypto market attempts downing at the 14-day SMA?
Yesterday’s trading session ended up with a smaller-length bearish candlestick to back and indicate a return of downward motion in the BCH/USD trade as the crypto market attempts downing at the 14-day SMA. The current force may lead the trading situation into a less-moving manner before finding support either around $250 or $200 levels in the long-term run of the crypto market.
On the downside of the technical analysis, it has less-weightily established that the BCH/USD market short-position takers may, with cautiousness; ride on the losing momentums to the southward side. It appears that a falling force has taken the topper stance presently. A sudden aggressive rebounding motion against the 14-day SMA trend line can lead the price to get repositioned at a higher trading resistance around the $400 level afterward. 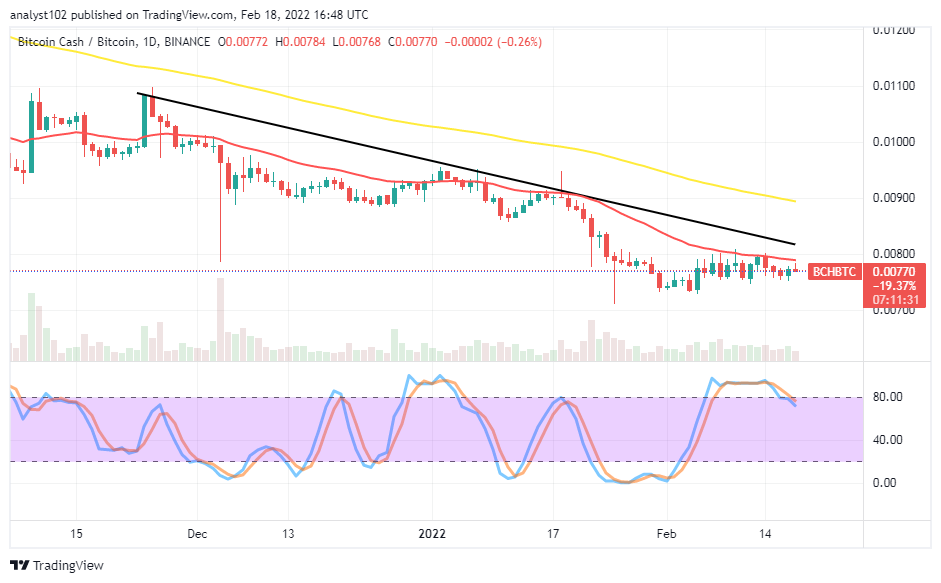
BCH/BTC Price Analysis
In comparison, Bitcoin Cash’s valuation trends in ranges as traded against Bitcoin beneath the trend lines of the SMAs. The cryptocurrency pair market attempts downing slightly more, showcasing the counter trading instrument has continually dominated the market arena at the expense of the base crypto’s weaknesses over time. The 14-day SMA indicator is underneath the 50-day SMA indicator. The Stochastic Oscillators are in the overbought region, briefly trying to move southbound against the range of 80. That suggests a sign that BCH has less probability of regaining the lost momentums against BTC.
Note: Cryptosignals.org is not a financial advisor. Do your research before investing your funds in any financial asset or presented product or event. We are not responsible for your investing results.
You can purchase crypto coins here. Buy Tokens