Bitcoin Cash (BCH/USD) Sees Bullish Intraday Move Amid Broader Consolidation
Estimated Reading Time: 3 minutes
Don’t invest unless you’re prepared to lose all the money you invest. This is a high-risk investment and you are unlikely to be protected if something goes wrong. Take 2 minutes to learn more

Bitcoin Cash demonstrated notable bullish momentum during today’s trading session, characterized by active price swings that signal heightened near-term volatility.
Despite this upward move in the crypto signal, the overall market structure remains within a consolidation phase. For the bulls to solidify control and initiate a sustained uptrend, a decisive and sustained break above the $523 resistance level is critical.
Bitcoin Cash (BCH/USD) Market Data
- BCH/USD Price Now: $513
- BCH/USD Market Capitalization: $10 billion
- BCH/USD Circulating Supply: 19.95 million BCH
- BCH/USD Total Supply: 19.95 million BCH
- BCHI/USD CoinMarketCap Ranking: #12
Key Levels to Watch
- Resistance: $540, $550, $600
- Support: $450, $400, $350
Bitcoin Cash (BCH/USD) Daily Chart Analysis
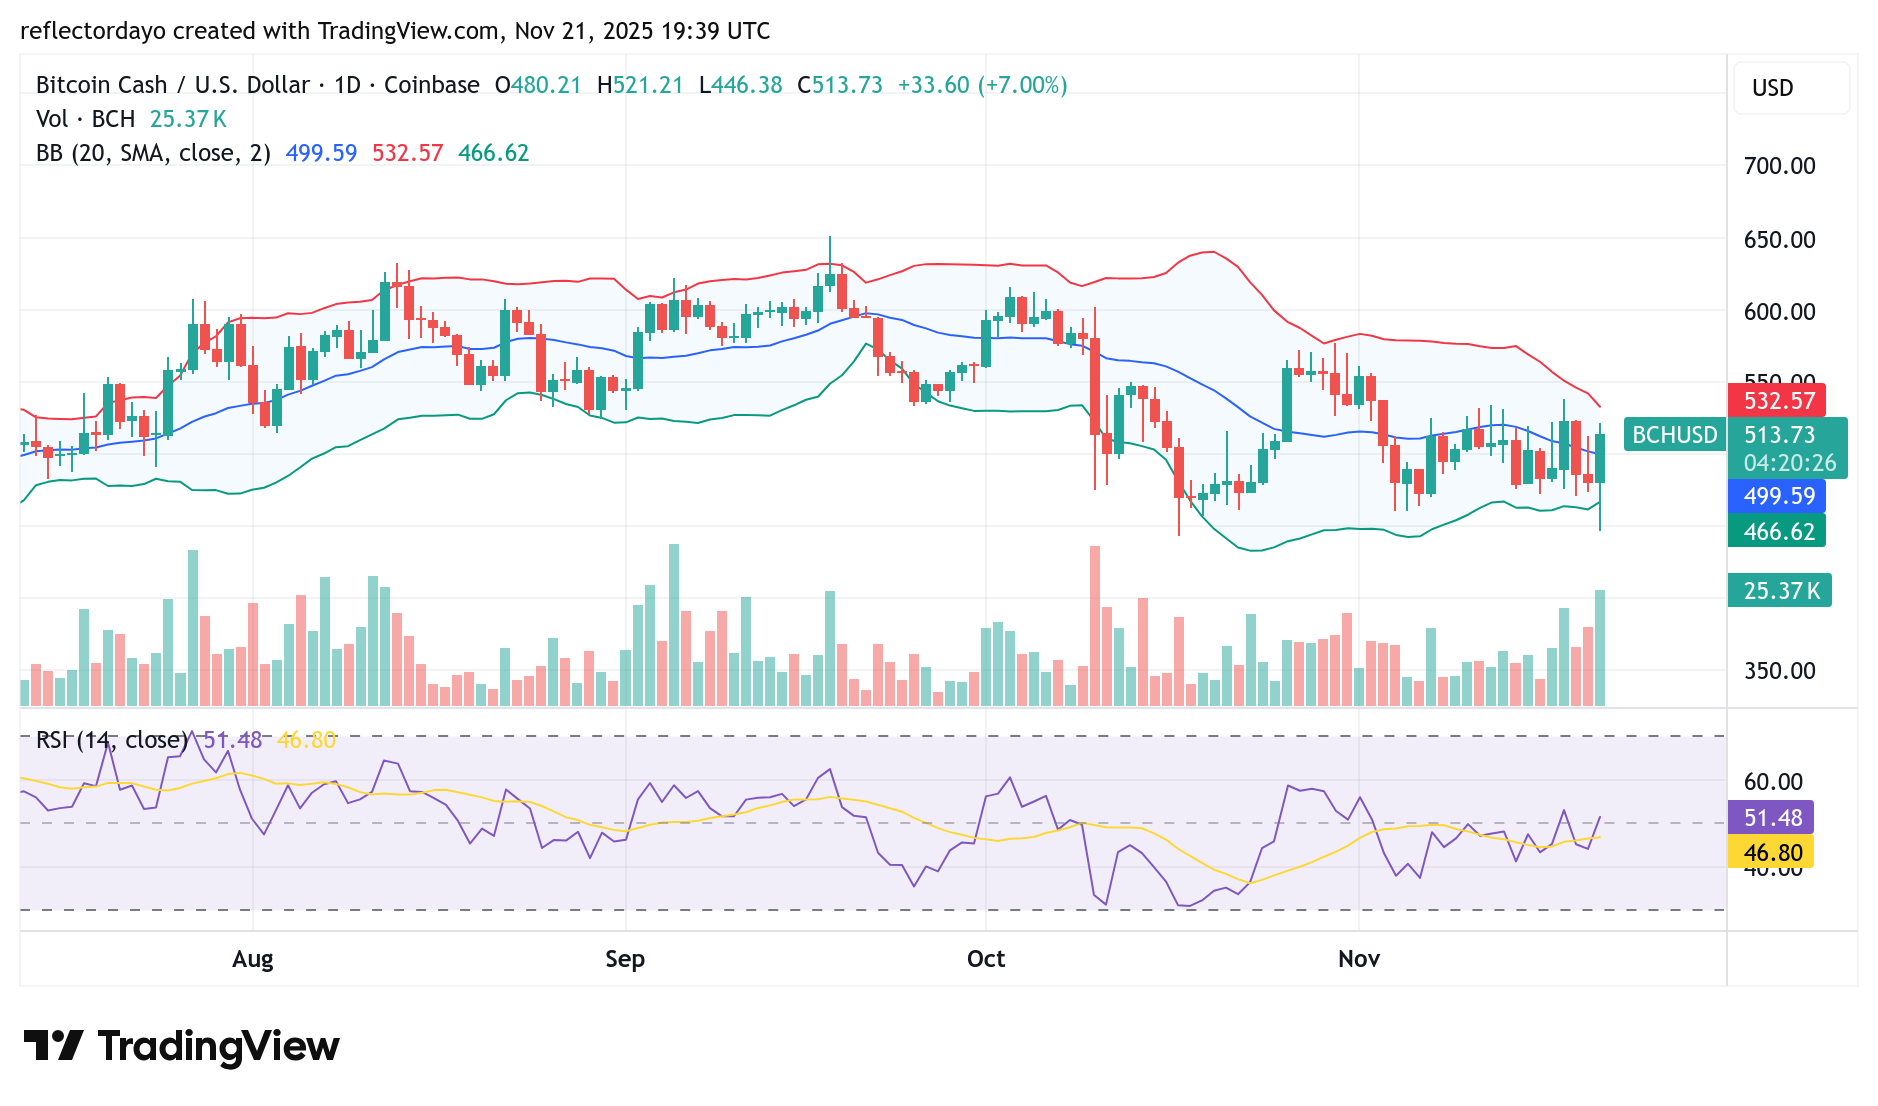
From a daily chart perspective, Bitcoin Cash is trading within a defined consolidation phase, exhibiting a lack of clear directional bias. Despite this range-bound activity, the market continues to demonstrate substantial investor participation, as evidenced by consistently robust trading volume. This indicates a high level of trader interest even in the absence of a strong trend.
Technically, the convergence of the Bollinger Bands signals a pronounced contraction in volatility. This tightening, coupled with a notable spike in volume during today’s session, often precedes a significant price movement. The market appears to be coiling around the $500 level, suggesting that a decisive breakout from this equilibrium is increasingly probable.
BCH/USD 4-Hour Chart Outlook
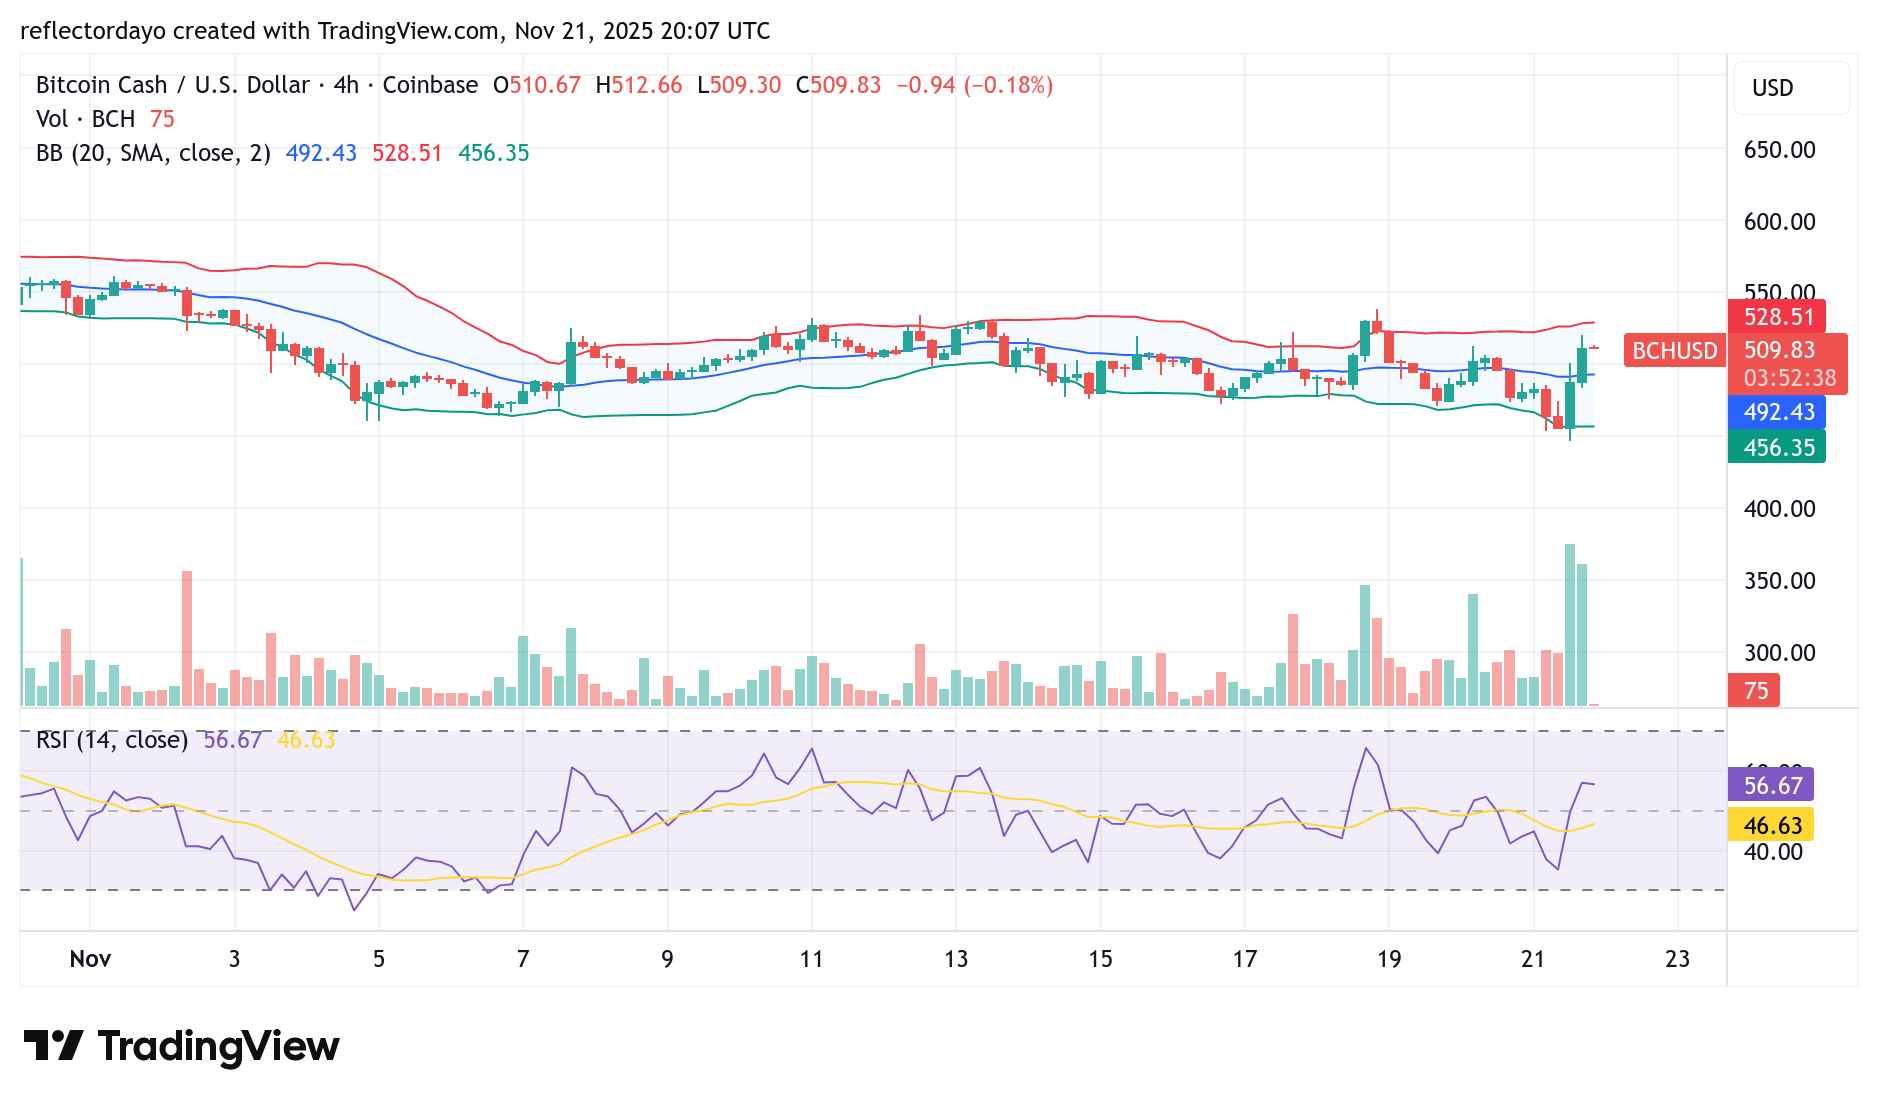
The session opened near $481, with an initial wave of selling pressure driving the price down to the $450 support level. From this point, strong bullish momentum emerged, fueling a significant rally that pushed the market toward a key resistance zone at $533.
This resistance level appears formidable, as indicated by the development of upper wicks on recent candlesticks—a classic sign of seller activity. A test of the $533 level could trigger a significant pullback. Should such a correction occur, the $500 level is likely to act as the next major support and a potential rebound zone.