Cartesi (CTSI/USD) Bearish Trend Recoils Near $0.03 Support
Estimated Reading Time: 3 minutes
Don’t invest unless you’re prepared to lose all the money you invest. This is a high-risk investment and you are unlikely to be protected if something goes wrong. Take 2 minutes to learn more
On the daily chart, Cartesi continues to trade within a broader bearish trend, with price action still pointing lower overall. However, in recent trading sessions, the market has found support around the $0.03 level, where buying interest has begun to emerge.
This reaction suggests the presence of bullish sentiment at this price zone, leading to a modest rebound. The key question now is whether this initial recovery can develop into a full-fledged bullish reversal or if it will remain a temporary pause within the broader downtrend.
A closer look at the indicators may offer further insight into the crypto signal’s next likely move.
Cartesi (CTSI/USD) Market Data
- CTSI/USD Price Now: $0.0324
- CTSI/USD Market Capitalization: $28.96 million
- CTSI/USD Circulating Supply: 890.88 million CTSI
- CTSI/USD Total Supply: 1 billion CTSI
- CTSI/USD CoinMarketCap Ranking: #580
Key Levels to Watch
- Resistance: $0.040, $0.045, $0.050
- Support: $0.030, $0.025, $0.020
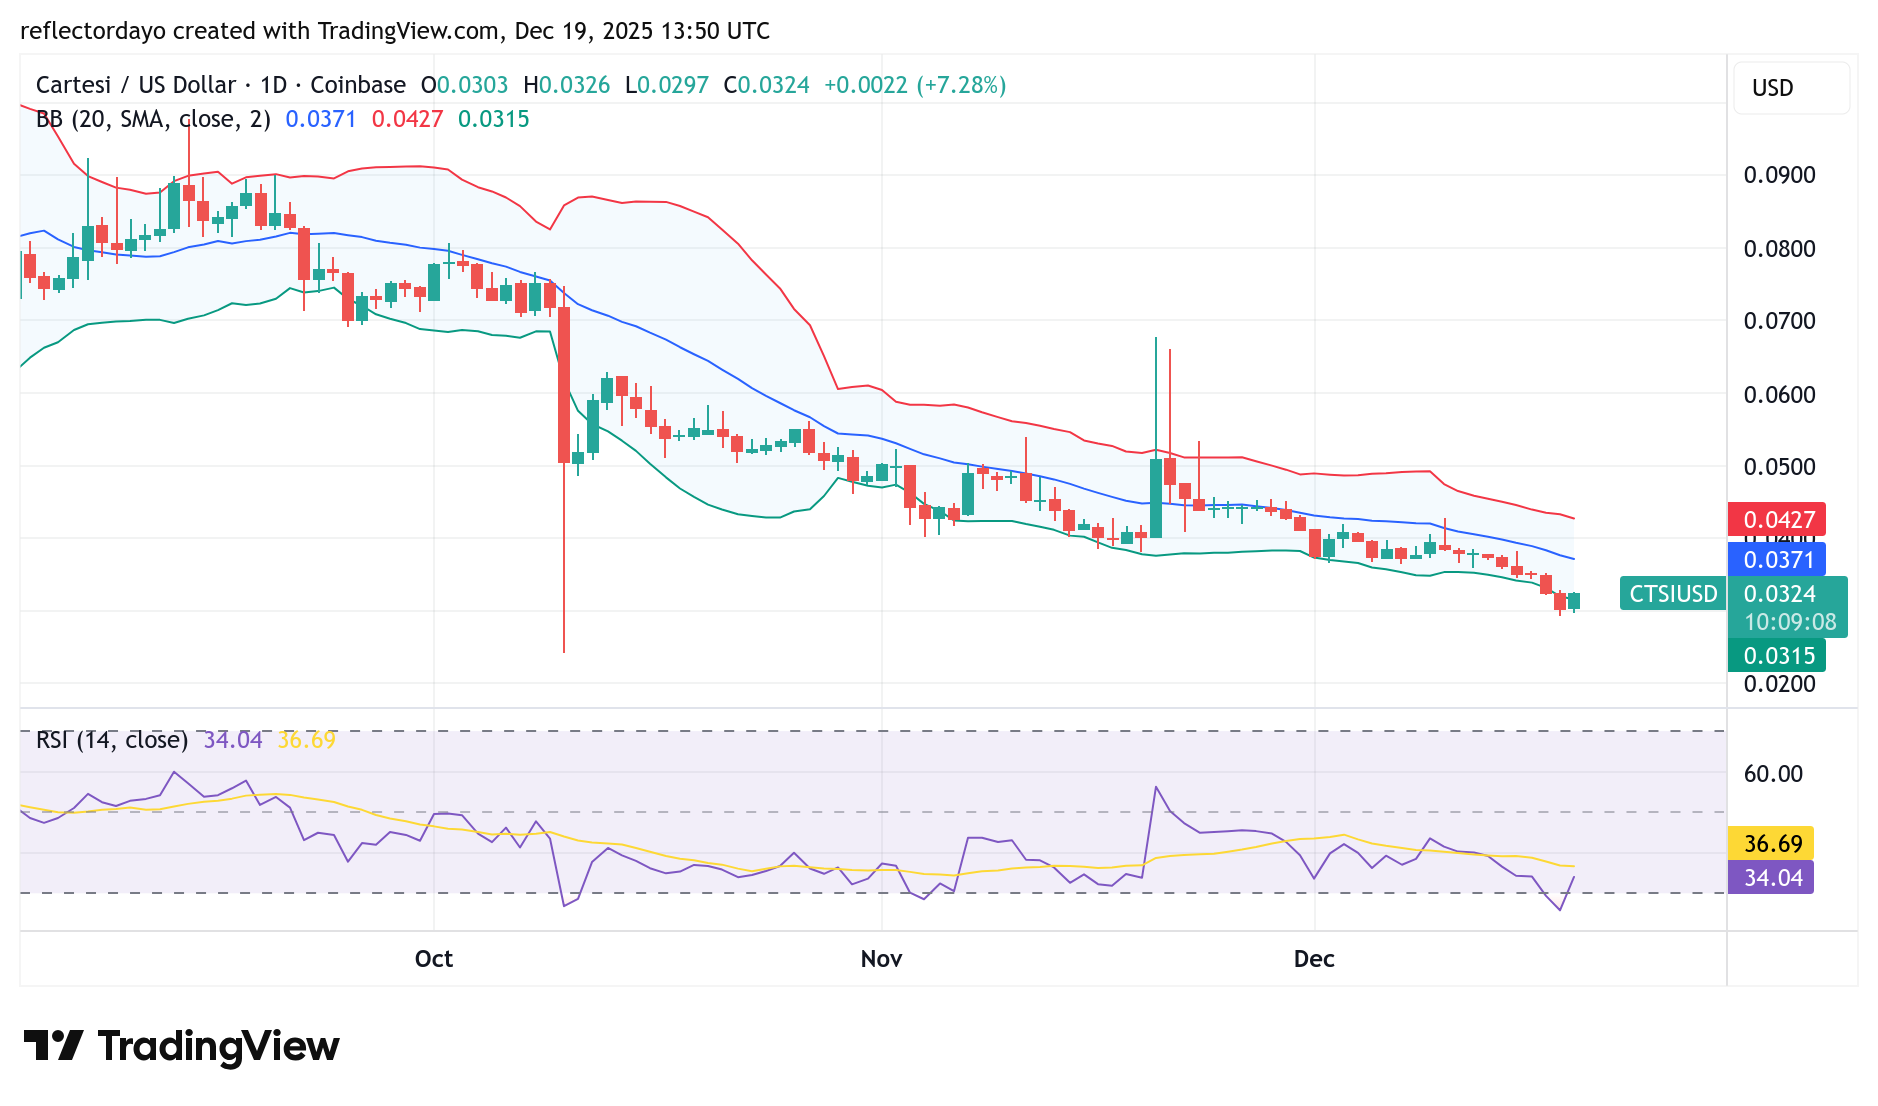
Cartesi (CTSI/USD) Daily Chart Analysis
The Bollinger Bands indicate a clear downward trend, reflecting growing bearish pressure in the Cartesi market. In October, price action tested levels near $0.02, and since then the market has gradually drifted back toward this zone.
Currently, the bearish move has encountered a temporary roadblock around the $0.03 level. However, the ongoing bullish response appears weak and has yet to develop into a strong recovery. This lack of follow-through suggests the market may enter a consolidation phase rather than stage an immediate reversal.
That said, the Relative Strength Index (RSI) is hovering near the oversold region, a condition that could encourage renewed bullish interest around this price area. Market reaction near this zone will be important in determining whether buyers can regain meaningful control.
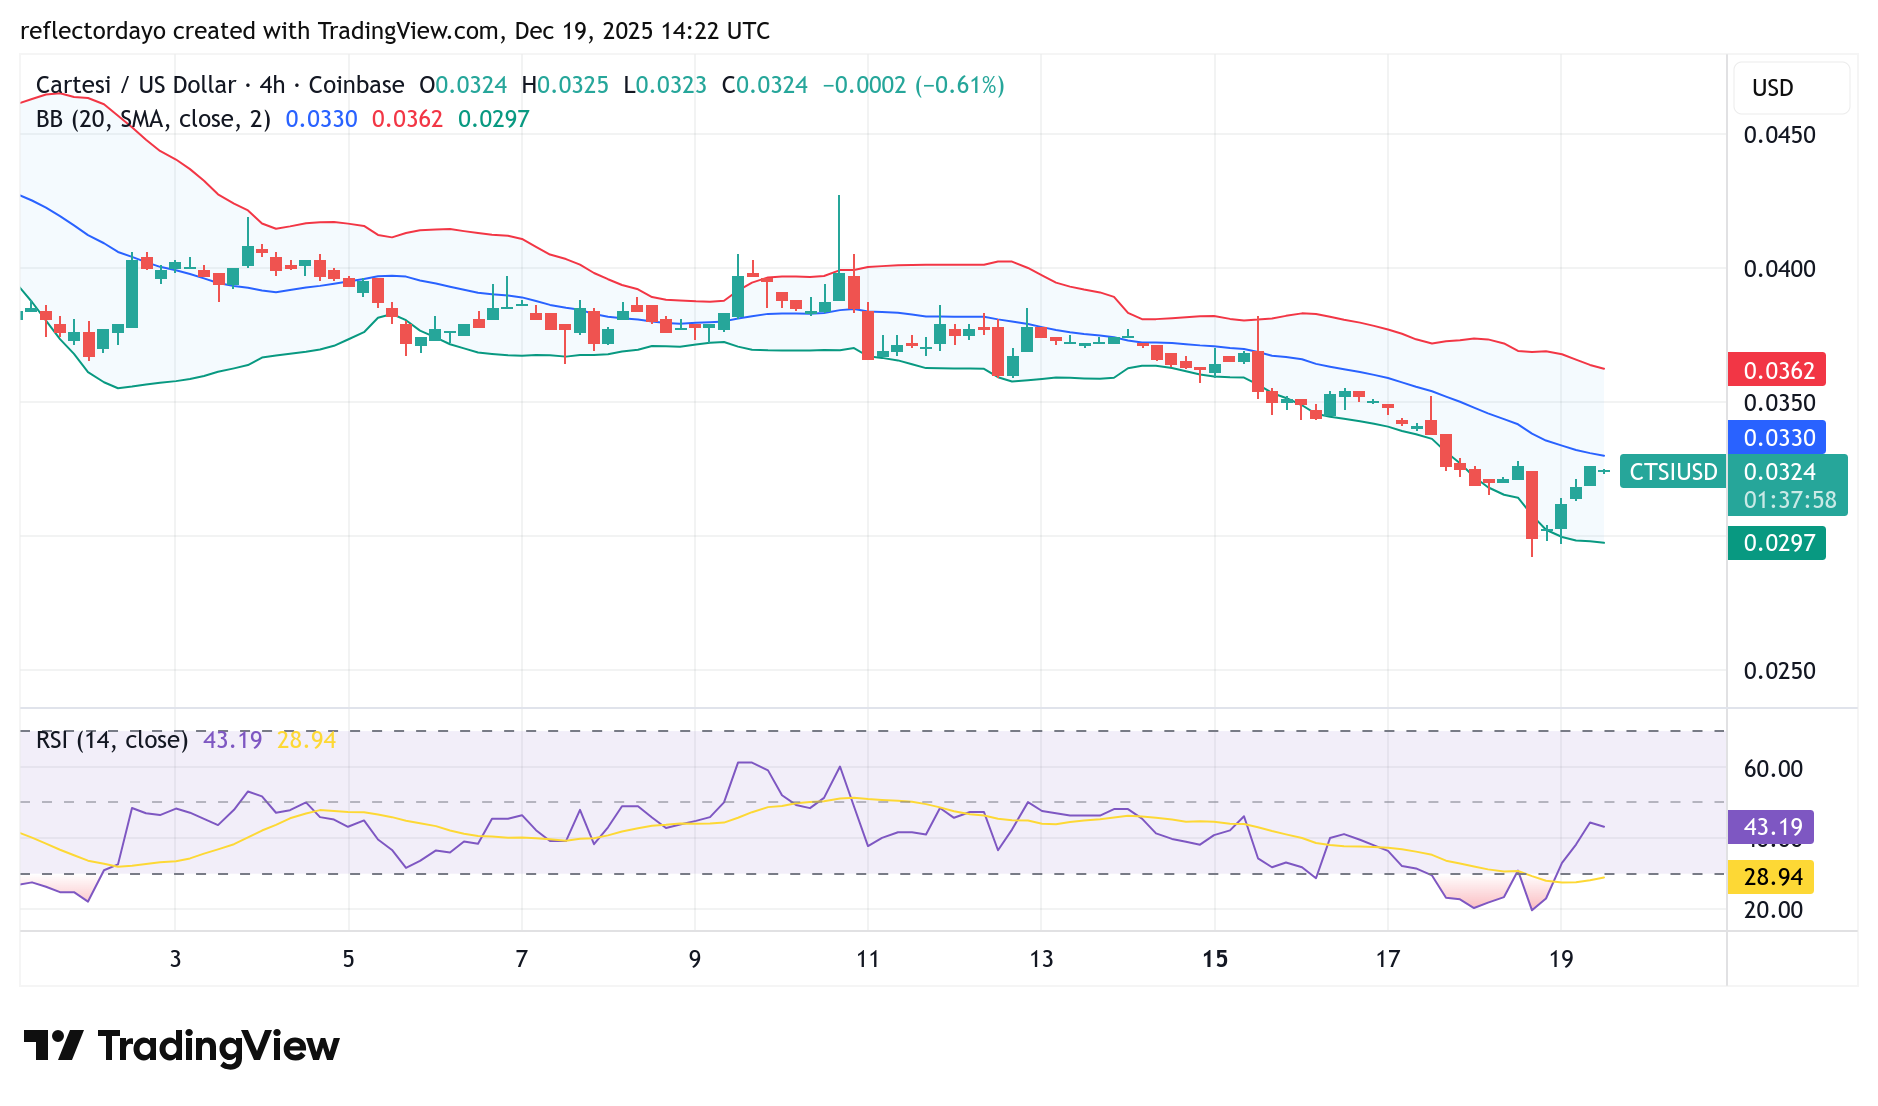
CTSI/USD 4-Hour Chart Outlook
On the smaller timeframe, the recent bearish move triggered a noticeable spike in market volatility. However, bullish interest around the $0.03 price level pushed the market higher, where price encountered resistance near the $0.0326 level.
The current trading session has formed a flat four-price doji candlestick, highlighting indecision between buyers and sellers. Meanwhile, the Bollinger Bands display a relatively wide bandwidth, suggesting the potential for a strong price move.
That said, if the ongoing standoff between bulls and bears persists, price may fail to break out in either direction, leading to continued consolidation around the $0.03 support level.