Celestia (TIA/USD) Bounces Back at a Higher Price Level
Estimated Reading Time: 2 minutes
Don’t invest unless you’re prepared to lose all the money you invest. This is a high-risk investment and you are unlikely to be protected if something goes wrong. Take 2 minutes to learn more

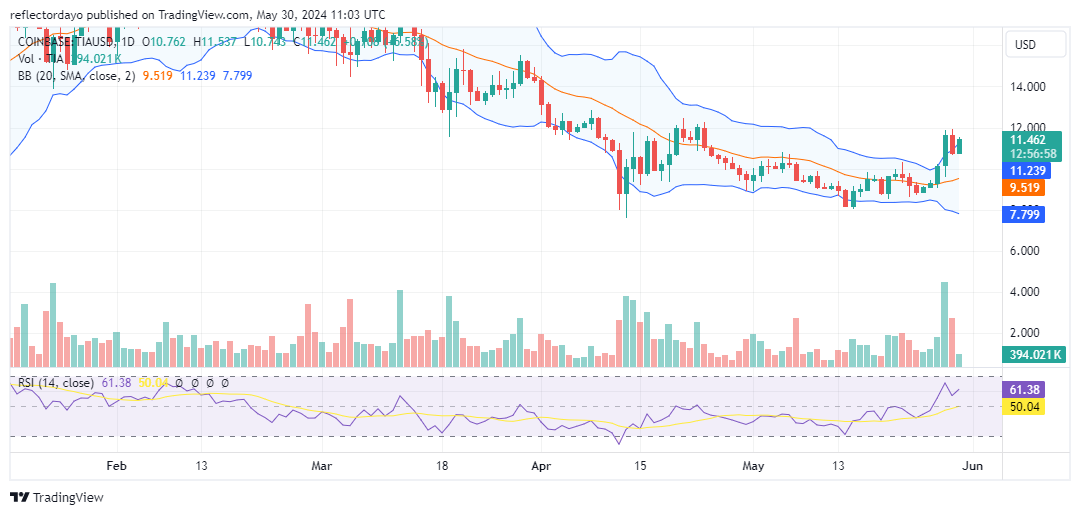
Since February 10, the Celestia market has experienced a downtrend after peaking at $21.10. However, in April, the $8.00 level emerged as a support, preventing further decline. Since then, the Celestia price has ranged around this support level until late May, when it began to surge upward. The market action broke through the $10.00 level but now faces resistance at the $12.00 level.
Celestia Market Data
- TIA/USD Price Now: $10.98
- TIA/USD Market Cap: $176 million
- TIA/USD Circulating Supply: 187 million
- TIA/USD Total Supply: 1 billion
- TIA/USD CoinMarketCap Ranking: #55
Key Levels
- Resistance: $12.00, $12.50, and $13.00
- Support: $9.50, $9.00, and $8.50.
The Celestia Market Through the Lens of Indicators
After a minimal support level was established at $8.80, the market surged significantly, breaking through the $10.00 and $11.00 resistance levels. However, the price action is now facing formidable resistance at $12.00. A bullish rush on May 28 pushed the market towards the $12.00 level, but resistance re-emerged at this point, as it did in April when bulls first secured support at $8.00. Although the market shows bullish sentiment, the price action at the $12.00 level is not strong enough to suggest an imminent breakthrough. The Bollinger Bands indicator currently shows a highly volatile market. The bulls may need to establish another support level near $12.00 to sustain further upward movement.
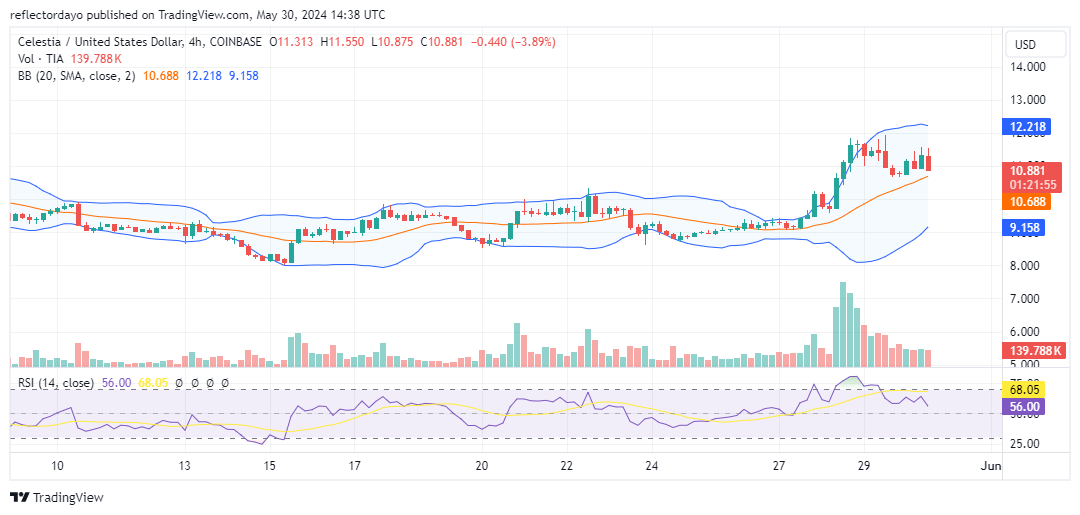
TIA/USD Price Prediction: 4-Hour Chart Analysis
The market outlook from the 4-hour chart reveals an upward trend, indicating that bulls are maintaining their position despite encountering strong resistance at the $12.00 level. Although there is significant bearish pressure around this level, bulls are holding the $11.00 level as support. If this support holds, pressure will likely shift back towards the $12.00 level. Over the past few 4-hour sessions, the price action has consistently bounced off this support, which is encouraging for bullish traders, provided the $11.00 support level is sustained.