Orchid (OXT/USD): Bullish Signs Hint at a Potential Price Surge
Estimated Reading Time: 2 minutes
Don’t invest unless you’re prepared to lose all the money you invest. This is a high-risk investment and you are unlikely to be protected if something goes wrong. Take 2 minutes to learn more

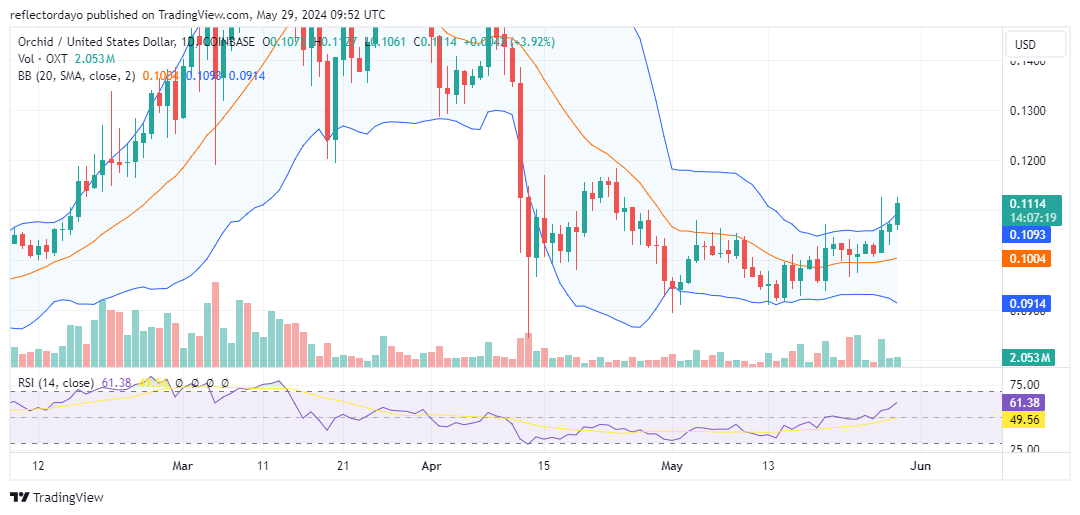
Indications from the chart suggest that the Orchid market may be starting another bullish run. The market has taken off from the $0.09 price level and has now broken above the crucial $0.11 level. About three sessions ago, when the market surged to this critical resistance, bearish pressure sent the market back down, cutting short the bullish momentum. However, in yesterday’s trading session, a bullish hammer candlestick hinted at the buildup of bullish momentum as the market approached the $0.11 level.
Orchid Market Data
- OXT/USD Price Now: $0.1115
- OXT/USD Market Cap: $110 million
- OXT/USD Circulating Supply: 980 million
- OXT/USD Total Supply: 1 billion
- OXT/USD CoinMarketCap Ranking: #456
Key Levels
- Resistance: $0.115, $0.120, and $0.125
- Support: $0.10, $0.097, and $0.090.
The Orchid Market Through the Lens of Indicators
The market momentum, as measured by the Relative Strength Index (RSI), stands at 61.6, indicating a fair dominance of the bulls. If bullish traders can sustain this momentum, the market may continue to surge upward. Today’s candlestick represents strong bullish activity, suggesting that traders are adopting a bullish sentiment following the breakout above the $0.11 resistance level.
However, the Bollinger Bands indicator signals the potential for a small price correction due to overbought conditions. The price action extending beyond the upper band is a sign of this overbought state. If the Orchid market corrects itself, the $0.11 price level, having shown sustainability, will likely become the new support level.
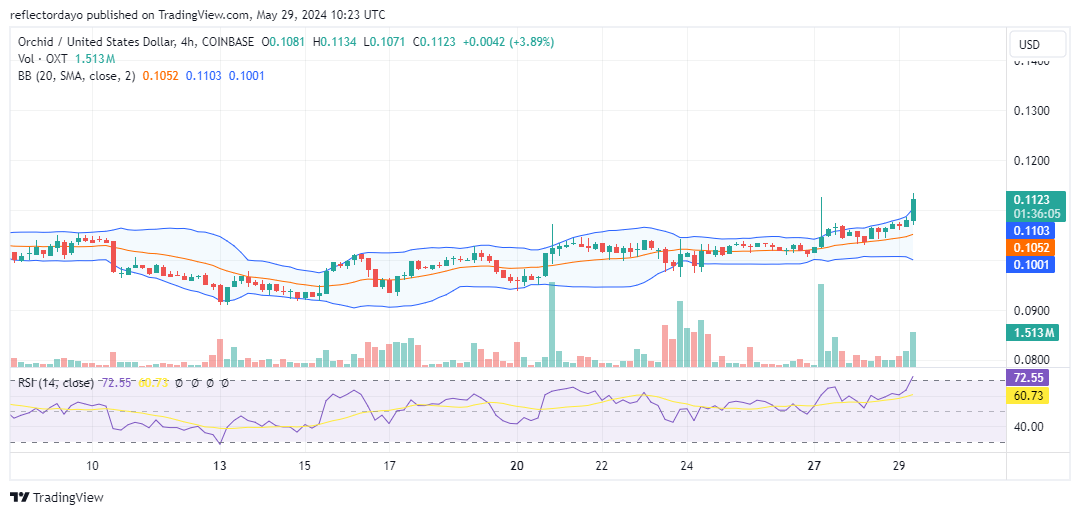
OXT/USD Price Prediction: 4-Hour Chart Analysis
On a smaller timeframe, both the Bollinger Bands and the Relative Strength Index (RSI) indicate an overbought market condition. However, the volume of trade indicator shows growing histogram heights, with the current histogram being the tallest. This crypto signal suggests that the upward trend may continue, as the increasing volume reflects a growing bullish bias among traders.