Chiliz (CHZ/USD) Breaks Above the $0.07 Price Level
Estimated Reading Time: 3 minutes
Don’t invest unless you’re prepared to lose all the money you invest. This is a high-risk investment and you are unlikely to be protected if something goes wrong. Take 2 minutes to learn more
Yesterday, the Chiliz market surged significantly, approaching the critical $0.07 price level. At this point, the market faced a cluster of bearish pressure as traders began taking profits near this level. However, in a favorable turn of events for bullish traders, the market broke above the $0.07 level as bullish momentum overpowered the bearish bias. The price surged to a peak of $0.078, nearing $0.08, before a correction occurred. Profit-taking activities have since caused the market to settle at $0.0735.
Chiliz Market Data
- CHZ/USD Price Now: $0.073
- CHZ/USD Market Cap: $662 million
- CHZ/USD Circulating Supply: 9 billion
- CHZ/USD Total Supply: 9 billion
- CHZ/USD CoinMarketCap Ranking: #97
Key Levels
- Resistance: $0.080, $0.085, and $0.090
- Support: $0.060, $0.055, and $0.050.
The Chiliz Market Through the Lens of Indicators
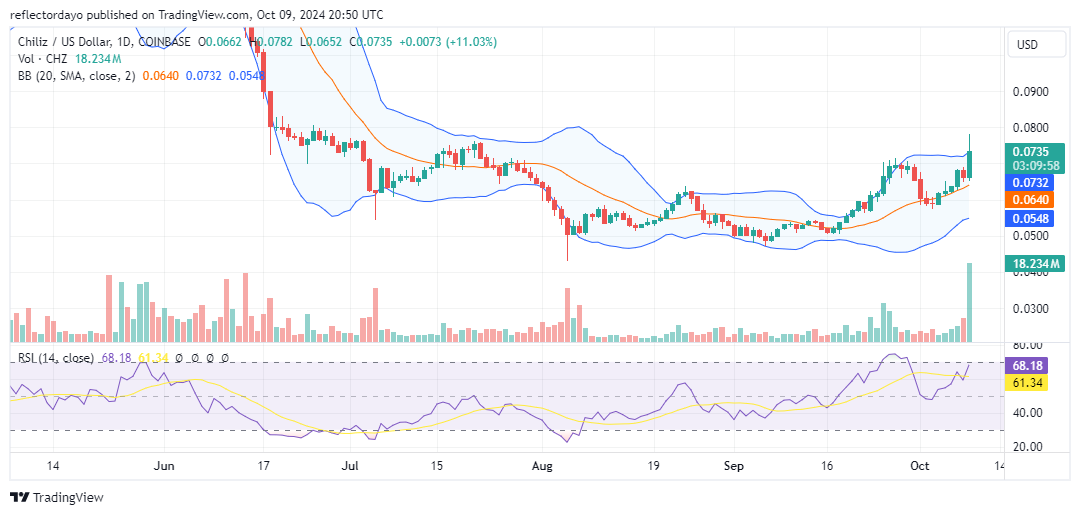
Yesterday, the Chiliz market surged significantly toward the $0.07 price level, encountering resistance at this threshold. Despite a brief pullback, the market demonstrated strong bullish sentiment, with a support level emerging at $0.066, which remained the dominant price for much of the day. This crypto signal support reignited investor interest, driving the price upward, nearly reaching $0.08. Afterward, a slight correction occurred, and the market currently stands above $0.07, specifically at $0.0735. The trading volume indicator shows strong, prominent histograms, reflecting heightened investor interest in today’s market. Comparing the histogram with the current candlestick pattern suggests that supply and demand have reached equilibrium at the $0.0735 level. However, if the correction continues, $0.07 is likely to hold as a support level, allowing the price to maintain its upward trajectory.
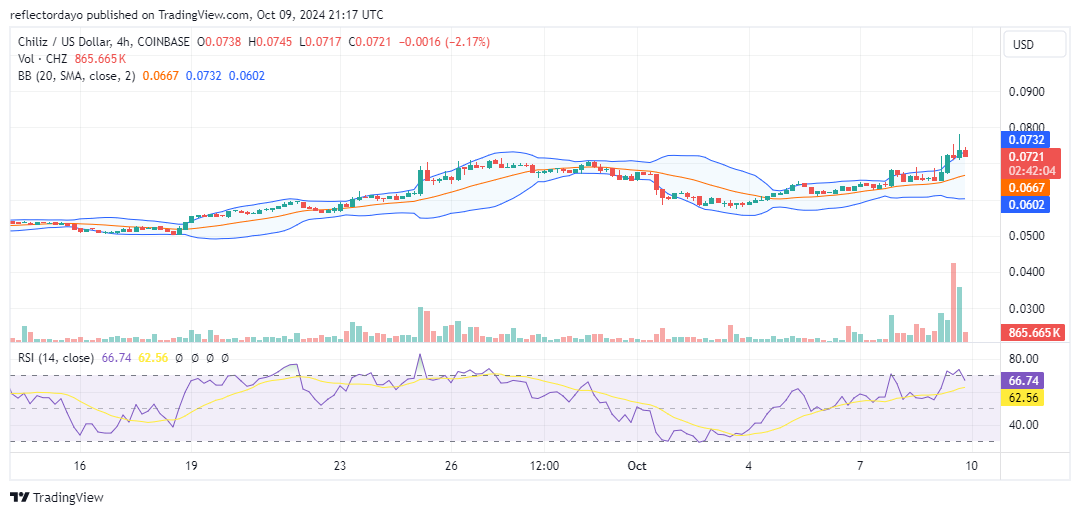
CHZ/USD Price Prediction: 4-Hour Chart Analysis
In the smaller timeframe, the market correction appears to be ongoing. The last three consecutive candlesticks have upper shadows, indicating continued selling pressure. As a result, the market may still be heading toward the $0.07 price level, where a potential bounce could occur. Looking at the most recent session, the bearish candlestick is small, and the trading volume histogram has significantly declined. This suggests that the bearish momentum is weakening, indicating that the bulls may have already established a presence at this level, positioning the market for a potential bullish reversal.