Curve (CRV/USD) Bulls Defend the $0.50 Level Amid Volatility
Estimated Reading Time: 3 minutes
Don’t invest unless you’re prepared to lose all the money you invest. This is a high-risk investment and you are unlikely to be protected if something goes wrong. Take 2 minutes to learn more

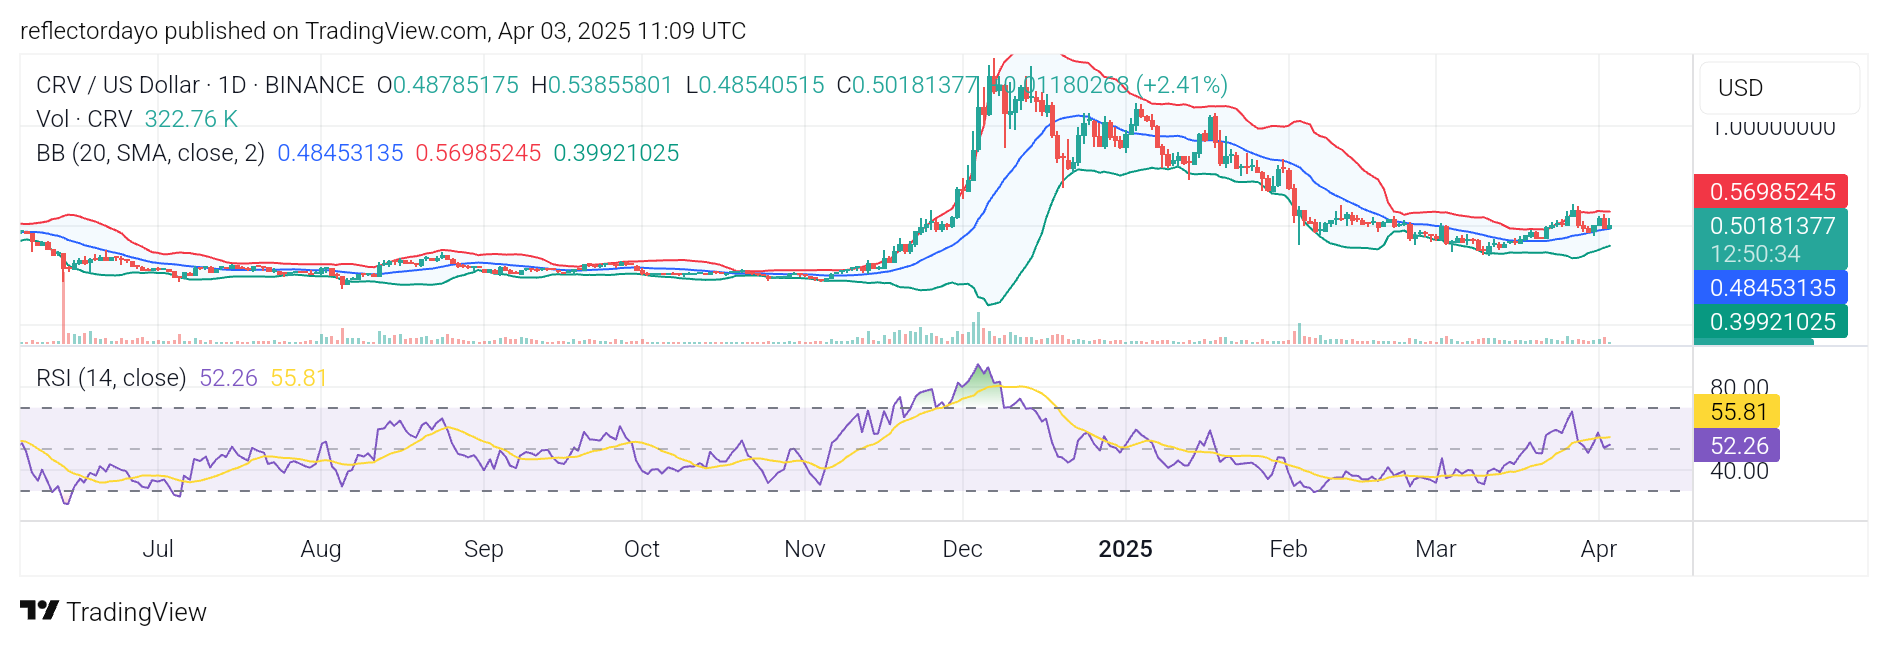
The Curve market has experienced persistent bearish price action for some time since its bullish run peaked above the $1.00 level late last year. However, a support level appears to be forming around the mid-channel price of $0.50, as traders consolidate their sentiment at this key level. This development suggests that bullish momentum may be gradually strengthening, potentially shifting market dynamics in favor of the bulls.
Curve Market Data
- CRV/USD Price Now: $0.49
- CRV/USD Market Cap: $ 648 million
- CRV/USD Circulating Supply: 1.3 billion CRV
- CRV/USD Total Supply: 2.2 billion CRV
- CRV/USD CoinMarketCap Ranking: #83
Key Levels
- Resistance: $1.00, $1.50, and $2.00
- Support: $0.4, $0.35 and $0.30
Curve Market Through the Lens of Indicators
The Curve bearish run initially encountered resistance at the $0.50 level in February. However, persistent selling pressure eventually pushed the price below this critical level. Despite this, bullish resilience prevented further declines, with buyers establishing support around the $0.35 mark.
On March 12, the market experienced a pivotal shift in direction, gaining upward momentum toward $0.50. By the end of March, bullish price action surged above this key level but soon peaked as traders began taking profits. The subsequent pullback saw the price decline, but $0.50 emerged as a strong support level, reinforcing bullish sentiment.
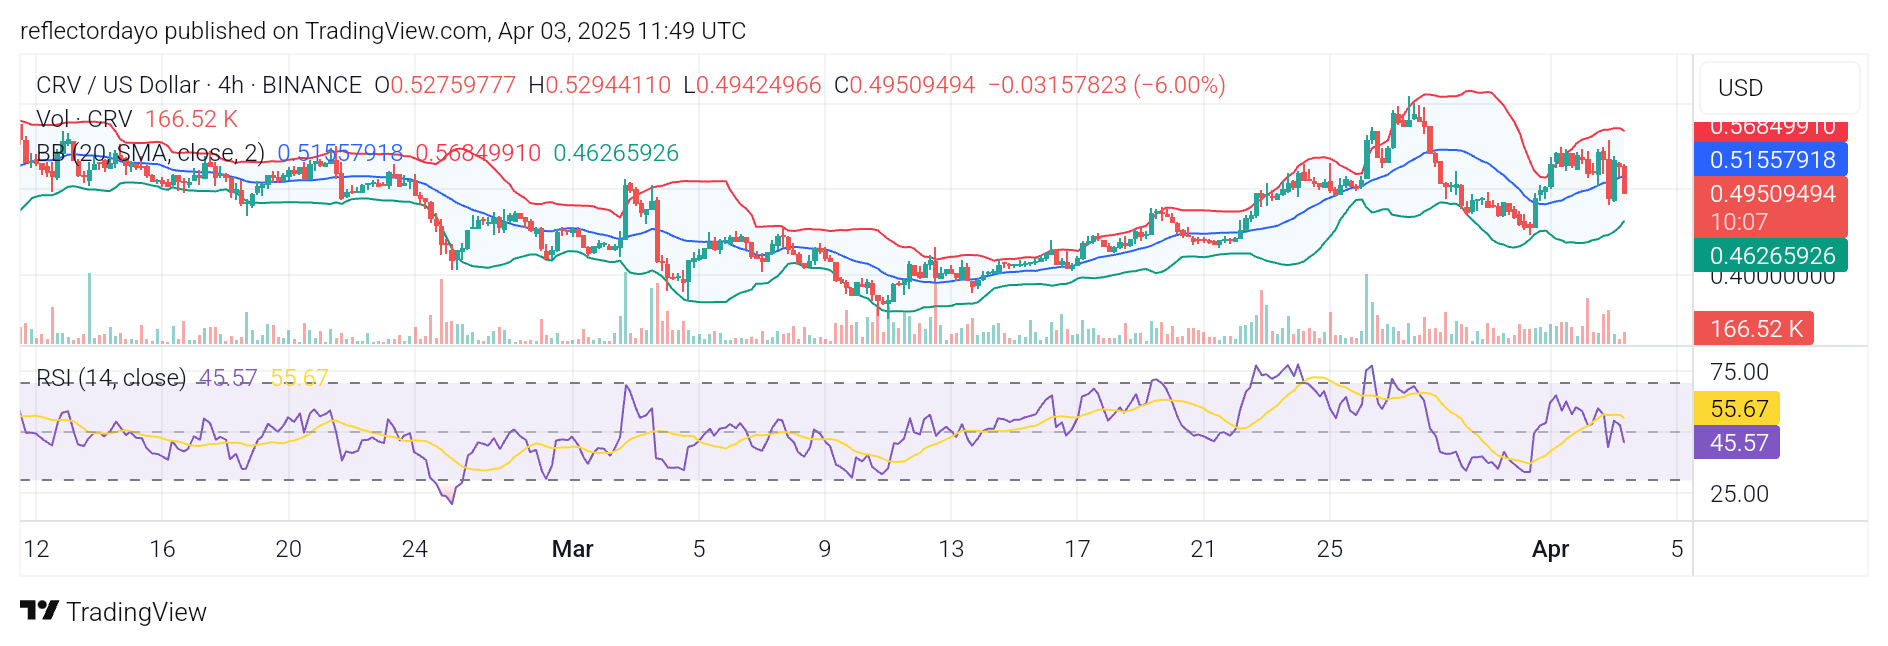
CRV/USD Price Outlook: Key Insights from the 4-Hour Chart
Zooming into the smaller timeframe, the indicators reflect erratic price movements, highlighting increased volatility. This suggests the potential for significant price swings, which is currently playing out on the chart.
Despite the market’s turbulence, bulls appear to be consolidating around the $0.50 level. Their ability to hold ground at this critical point, despite ongoing volatility, indicates that the market may be poised for bullish momentum. However, if demand and supply continue to balance each other out at this level, volatility could decrease, leading to a narrowing price channel. Such a volatility squeeze often precedes a significant price movement, making this a crucial level to watch.