Curve (CRV/USD) Establishes a Stronger Support Level
Estimated Reading Time: 3 minutes
Don’t invest unless you’re prepared to lose all the money you invest. This is a high-risk investment and you are unlikely to be protected if something goes wrong. Take 2 minutes to learn more
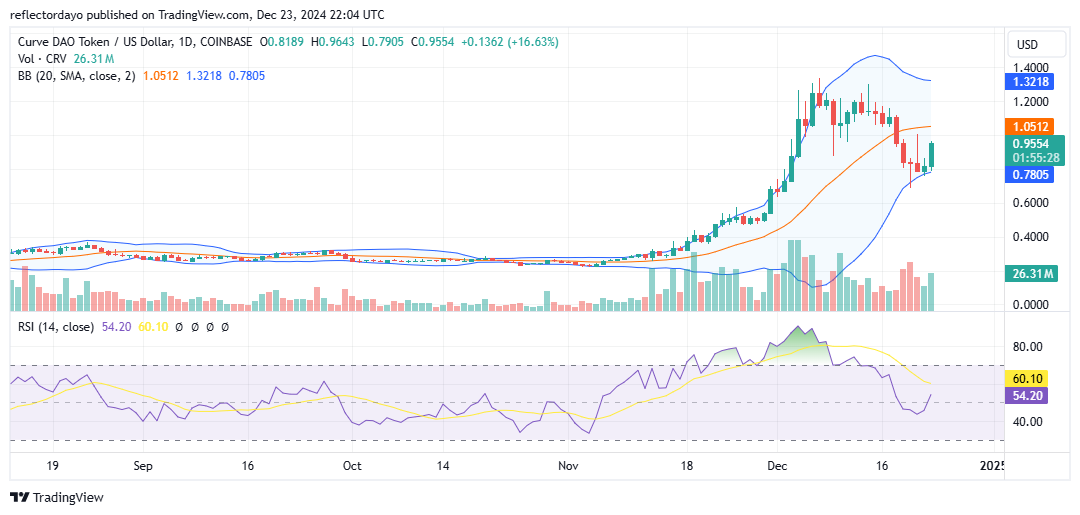
Between late November and early December, the Curve market experienced a significant bullish rally, reaching a peak above $1.200 and nearing the $1.400 price level. Following a period of consolidation around the $1.200 mark, bearish pressure emerged, driving the price downwards. However, this bearish trend was halted at the $0.800 support level. Subsequently, the market staged a recovery, potentially targeting the crucial $1.200 resistance level.
Curve Market Data
- CRV/USD Price Now: $0.954
- CRV/USD Market Cap: $1.2 billion
- CRV/USD Circulating Supply: 1.25 billion
- CRV/USD Total Supply: 2.2 billion
- CRV/USD CoinMarketCap Ranking: #86
Key Levels
- Resistance: $1.00, $1.100, and $1.200
- Support: $0.800, $0.700, and $0.600.
The Curve Market Through the Lens of Indicators
The preceding bull run witnessed a decline below the equilibrium line, indicating a transition into bearish territory, as confirmed by technical indicators. The Bollinger Bands indicator reveals that the price action dipped below the 20-day moving average. Concurrently, the Relative Strength Index (RSI) demonstrated a bounce from below the midpoint line.
While the candlestick pattern for today suggests bullish dominance in the daily trading session, with significant trading volume supporting this upward movement, the Bollinger Bands indicator highlights substantial volatility due to its wide bandwidth. This volatility may have been exploited by bullish forces to propel the crypto signal higher.
A critical resistance level for the ongoing Curve bull run is likely to be the $1.00 price level, based on historical price action.
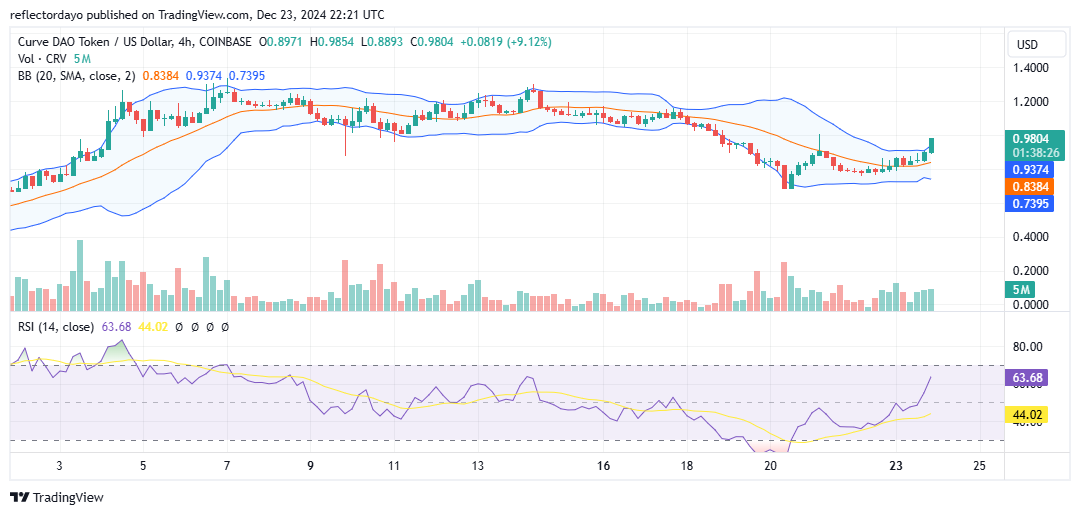
CRV/USD Price Prediction: 4-Hour Chart Analysis
Analysis of the 4-hour chart confirms the observation from the daily chart: the $1.00 price level may pose significant resistance to the market’s current rally. Traders should note that this level previously acted as a barrier to upward momentum. However, the bullish position at the $0.800 price level held firm. If both levels maintain their respective positions, the market may enter a period of consolidation. Conversely, a decisive break above the $1.00 level would likely attract further bullish sentiment.