Curve (CRV/USD): Poised to Elicit Bullish Sentiment
Estimated Reading Time: 3 minutes
Don’t invest unless you’re prepared to lose all the money you invest. This is a high-risk investment and you are unlikely to be protected if something goes wrong. Take 2 minutes to learn more
A few days ago, specifically on September 19th, there were speculations regarding the sustainability of the bullish trend in the Curve market. This uncertainty arose due to the significant bullish activity observed during the day, which was not adequately supported by trading volume.
Nevertheless, contrary to these initial expectations, the market has continued to exhibit bullish momentum, potentially signaling the possibility of attracting increased bearish sentiment in the near future. If the market continues along its current bullish trajectory, it may entice a greater influx of traders into the bullish market.
Curve Market Data
- CRV/USD Price Now: $0.464
- CRV/USD Market Cap: $393.56 Million
- CRV/USD Circulating Supply: 878,280,981 CRV
- CRV/USD Total Supply: 3.03 Billion
- CRV/USD CoinMarketCap Ranking: #87
Key Levels
- Resistance: $0.48, $0.50, and $0.55.
- Support: $0.40, $0.35, and $0.30.
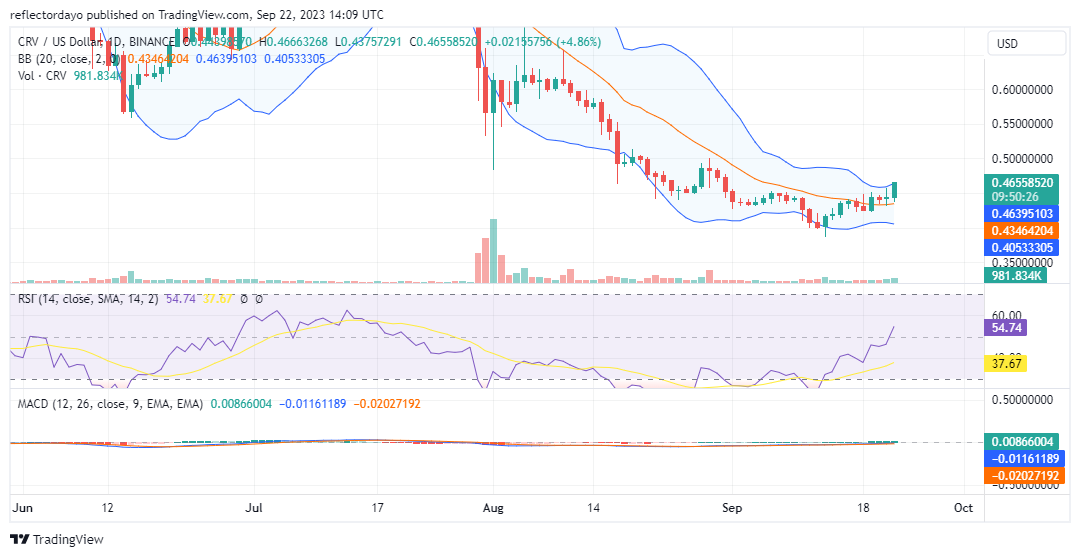
Price Prediction for Curve: The Indicators’ Point of View
The bullish sentiment within the Curve market can be attributed to the actions of a select group of influential traders who wield significant market sway. Through their substantial buying activity, they appear to be actively maintaining a bullish trend with the intention of catalyzing widespread buying interest and bullish sentiment among fellow market participants.
Upon a closer examination of the daily chart, one can discern a gradual increase in the volume of trade histograms. This indicates a growing influx of traders into the bullish market. However, the Bollinger Bands indicator has not responded as anticipated, failing to exhibit the expected divergence of its two standard deviations. This is somewhat surprising, given the considerable bullish movement that would typically trigger heightened market volatility.
Nonetheless, this peculiar situation may be attributed to the dominance of a select group of influential traders who appear to be driving the market in a largely one-sided direction.
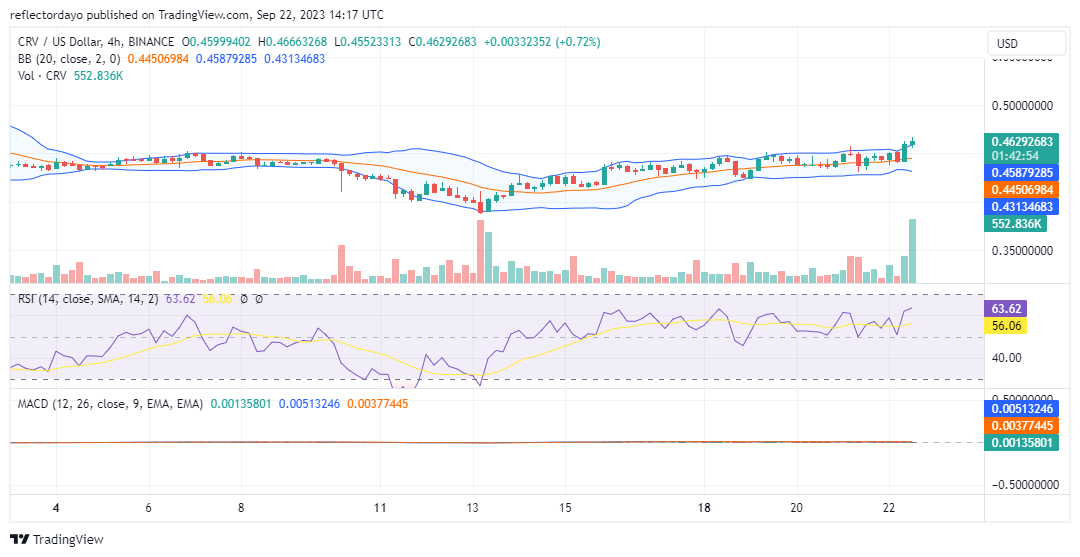
CRV/USD 4-Hour Chart Outlook
Examining a shorter timeframe, it becomes evident that the concerted effort to stimulate substantial buying activity in the market is materializing. This is primarily due to a noteworthy surge in trading volume. However, when observing the 4-hour chart’s Bollinger Bands indicator, it is apparent that significant divergence, indicative of heightened volatility, has not yet manifested.
Nonetheless, a closer inspection of the most recent trading session on the chart reveals a gradual uptick in volatility levels. Furthermore, an observation of the trade volume histogram shows a pronounced surge, coupled with a comparatively less substantial bullish candlestick. This suggests that certain long-position traders may be considering short positions to realize their profits.