Curve (CRV/USD) Recovers from Below the Year’s Low
Estimated Reading Time: 2 minutes
Don’t invest unless you’re prepared to lose all the money you invest. This is a high-risk investment and you are unlikely to be protected if something goes wrong. Take 2 minutes to learn more
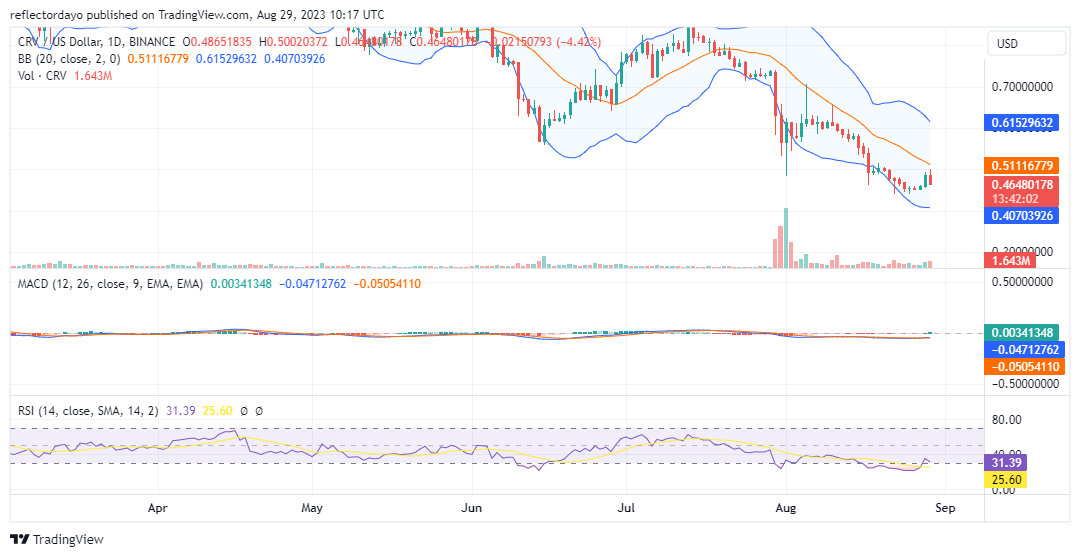
The Curve bear market could be approaching its conclusion, as it pushed the market below the year’s low of $0.5000. Traders’ interest in adopting long positions was revived around the $0.45 price mark. Market dynamics appear to have shifted since August 26, after the bull market established a firm foothold at the crucial support level. As a result, the last three days have exhibited a bullish trend.
Curve Market Data
- CRV/USD Price Now: $0.48
- CRV/USD Market Cap: $430,577,221
- CRV/USD Circulating Supply: 866,506,188 CRV
- CRV/USD Total Supply: 3,303,030,299 CRV
- CRV/USD CoinMarketCap Ranking: #75
Key Levels
- Resistance: $0.50, $0.55, and $0.60
- Support: $0.42, $0.40, and $0.38.
Price Prediction for Curve: The Indicators’ Point of View
The price level of $0.500 marks the beginning of the year. Curve initiated its market cycles starting from this point on January 1st. However, this very price level now functions as a resistance level. Whenever the price reaches this level, it promptly retreats to lower levels, indicating a prevailing bearish sentiment around $0.500.
Based on the indicators, it appears unlikely that the bulls possess the necessary strength to orchestrate a market recovery from this demand level. In fact, the market’s descent seems probable. This is attributed to the observation that the trading volume over the past three days of the bullish market has not been substantial enough to align with the robust bullish candlesticks. This phenomenon underscores the inability of the bulls to sustain a price rebound.
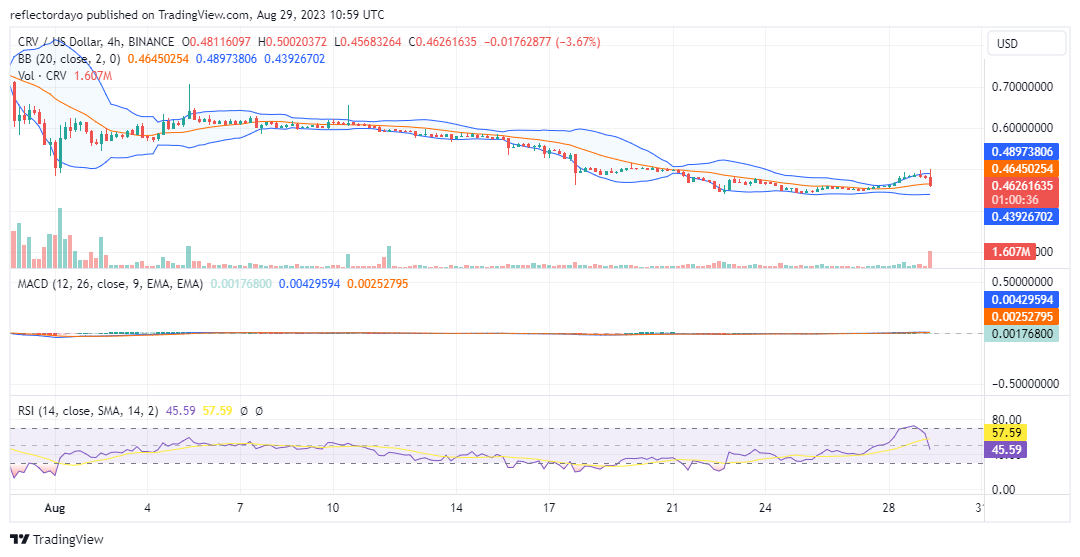
CRV/USD 4-Hour Chart Outlook
Examining the market through the 4-hour timeframe, it becomes evident that liquidity is increasingly gathering momentum within the bear market. This observation stems from the fact that the bearish candlestick is accompanied by a robust trade volume histogram. The quantity of traders inclined to sell has surged abruptly subsequent to the market reaching the $0.5000 price threshold. Should the bear market successfully breach the critical support level at $0.45, the subsequent probable area for a price rebound might be around the $0.4000 price mark.