Fantom (FTM/USD) Poised for Breakout from Prolonged Consolidation Phase
Estimated Reading Time: 3 minutes
Don’t invest unless you’re prepared to lose all the money you invest. This is a high-risk investment and you are unlikely to be protected if something goes wrong. Take 2 minutes to learn more

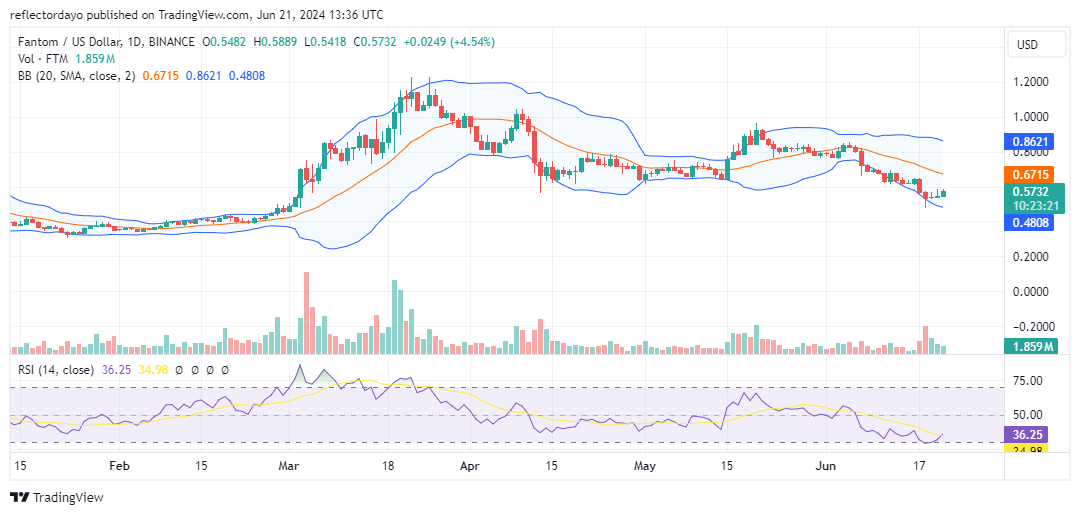
Since March, the market for Fantom (FTM/USD) has experienced a prolonged period of sideways movement following the peak of the bull run at the $1.20 price level. After the bears took control, the price settled into a range between $0.63 and $0.92, down from the previous range of $0.80 to $1.20. This tug-of-war for market dominance continued until recently, when the price broke below the $0.60 level.
Fantom Market Data
- FTM/USD Price Now: $0.57
- FTM/USD Market Cap: $1.6 billion
- FTM/USD Circulating Supply: 2.8 billion
- FTM/USD Total Supply: 3.2 billion
- FTM/USD CoinMarketCap Ranking: #53
Key Levels
- Resistance: $0.60, $0.65, and $0.70.
- Support: $0.45, $0.40, and $0.35.
Fantom Market Analysis: The Indicators’ Point of View
According to the chart, the Fantom market’s consolidation phase appears to have begun in early April, after the price settled below the $1.00 level. Despite this downturn, the market has retained its volatility, as evident in the rapid price oscillations between key support and resistance levels. Neither the bulls nor the bears have been able to capitalize on this volatility to establish a favorable market direction.
In the first half of May, market volatility decreased, leading to movement within a narrow price channel. By the second half of the month, the bulls attempted to push the market upwards but were exhausted near the $1.00 level. Recently, the market has broken down below the crucial $0.60 support level, which has held since March. This break could potentially lead to a consensus on market direction.
The market might either experience a gradual decline or attract dip-buying, which could turn the market back upward. However, it is more likely that the market will decline, as the bulls have not shown sufficient strength to sustain the price above $1.00. Additionally, the bears appear to have taken control around the $0.60 level, as indicated by the upper shadows on the candlesticks since the market broke below this support.
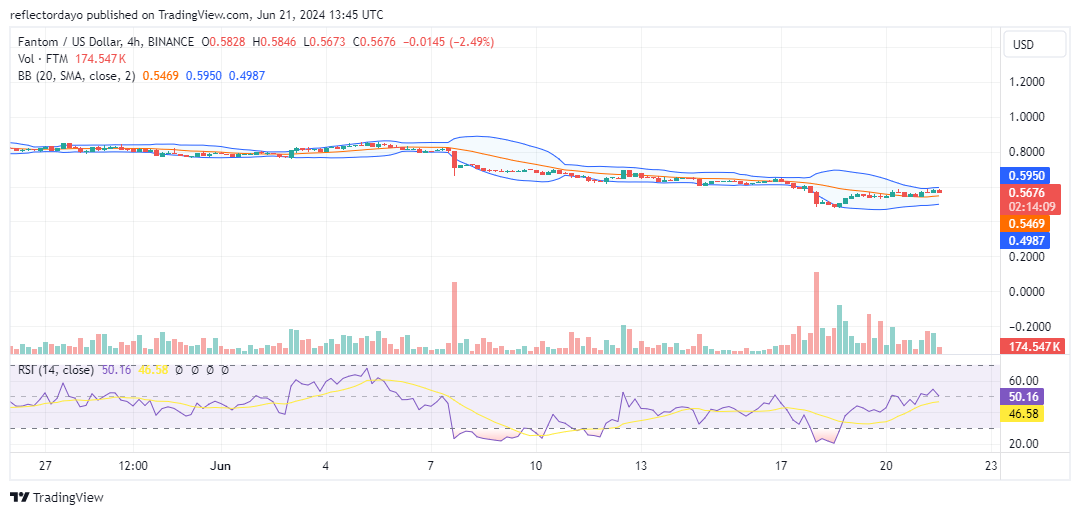
FET/USD 4-Hour Chart Outlook
Similar to the crypto signal observed from the daily chart, the price channel is tilting downward. The market has crossed a critical junction, with bears now occupying the $0.60 level, which was formerly the support level. Traders are still uncertain about buying the dip, indicating that the market may continue to fall. Indicators show the market at the midpoint, suggesting an equilibrium between demand and supply around this price territory, which can be considered bullish. However, it appears that the bears currently have the advantage.